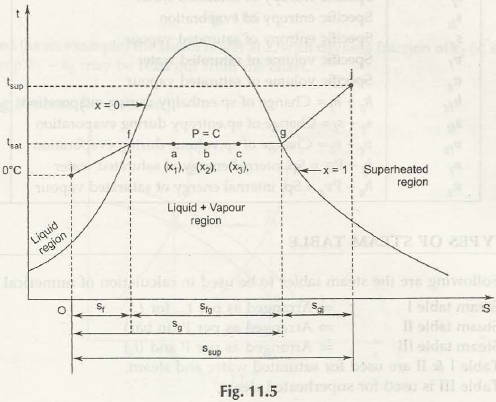
In the above figure 11.5, it shows an entropy diagram for 1 kg of water. This is chosen at an arbitrary at OOC whereby the steam is generated at a constant pressure. The heat is shown being heated in this pressure. You can go on and see that the area under the curve if is a representation of the heat that is transferred during the process from 0 degree Celsius to a stage where it reaches the saturation point of temperature. During if the entropy is S1 and this change to SFG occurs during the change of the phase which is brought about the heat during the stage of evaporation. As far as all the data is concerned it is available in the steam table and you can go on to undertake interpolation to derive its exact value of sorts.
Links of Previous Main Topic:-
- Conversion of work into heat
- Introduction to carnot cycle
- Clausius inequality entropy and irreversibility introduction
- Ideal gas or perfect gas
- Introduction about air standard cycles
- Properties of pure substances introduction
- Heating of pure substances other than ice
- Temperature enthalphy graph formation of steam
Links of Next Mechanical Engineering Topics:-


