Skewness is related with statistics which helps to describe asymmetry in regard to normal distribution in set of statistical data. In case of negative or positive skewness, this all depends on data points that are being skewed to left and negative or to right and positive of data average. A data set which reflects such characteristics may differ from its normal bell curve.
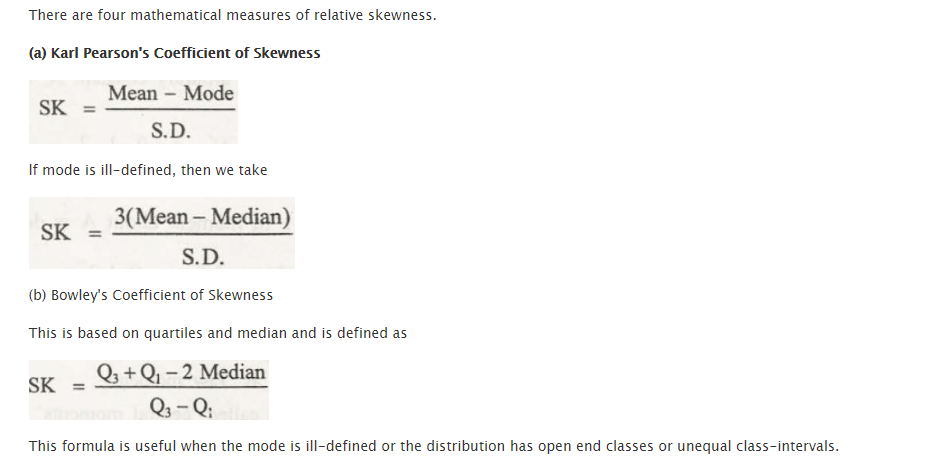
Skewness can be measured with the help of Pearson’s first coefficient of skewness. It is a measurement that subtract median from mode and finally divides difference by standard deviation. The second law may sometimes be used, in case the mode gets subtracted from median and finally multiplied by three and dividing it by standard deviation.
Formula of skewness
The formula of skewness that can help to find calculations manually are:
Skewness = (3 x (mean – median)) /standard deviation
To use this formula, it is important to stay acquainted with mean and median. The mean is referred to the average. The sum of value in data distribution is divided by number of values in distribution. In case the data distribution is available in numerical order, then the median would be the value that is found in middle.
Links of Previous Main Topic:-
Links of Next Statistics Topics:-
- Bivariate distribution
- Theorem of total probability addition theorem
- Random variable
- Binomial distribution
- What is sampling
- Estimation
- Statistical hypothesis and related terms
- Analysis of variance introduction
- Definition of stochastic process
- Introduction operations research
- Introduction and mathematical formulation in transportation problems
- Introduction and mathematical formulation
- Queuing theory introduction
- Inventory control introduction
- Simulation introduction
- Time calculations in network
- Introduction of game theory


