An analysis of the history of payouts; dividends and buybacks; presents a number of interesting facts and trends. For instance, it can be observed that while payouts have seen an increase in current times (as compared to historically), it is buybacks which have contributed more to this; whereas dividends have remained fairly the same. The lure of cashing in on these payouts has also led to increased stock prices. Things become clearer once we drill down, with some historical data to represent the case in point.
Historical payout patterns
Dividends:
There are three principal observations with respect to dividends across the years
- The dividend-payout ratio, also called the dividend-earning ratio has remained at a stable 50% for the S&P 500 firms in the post-World War years as illustrated by graph (a) below.
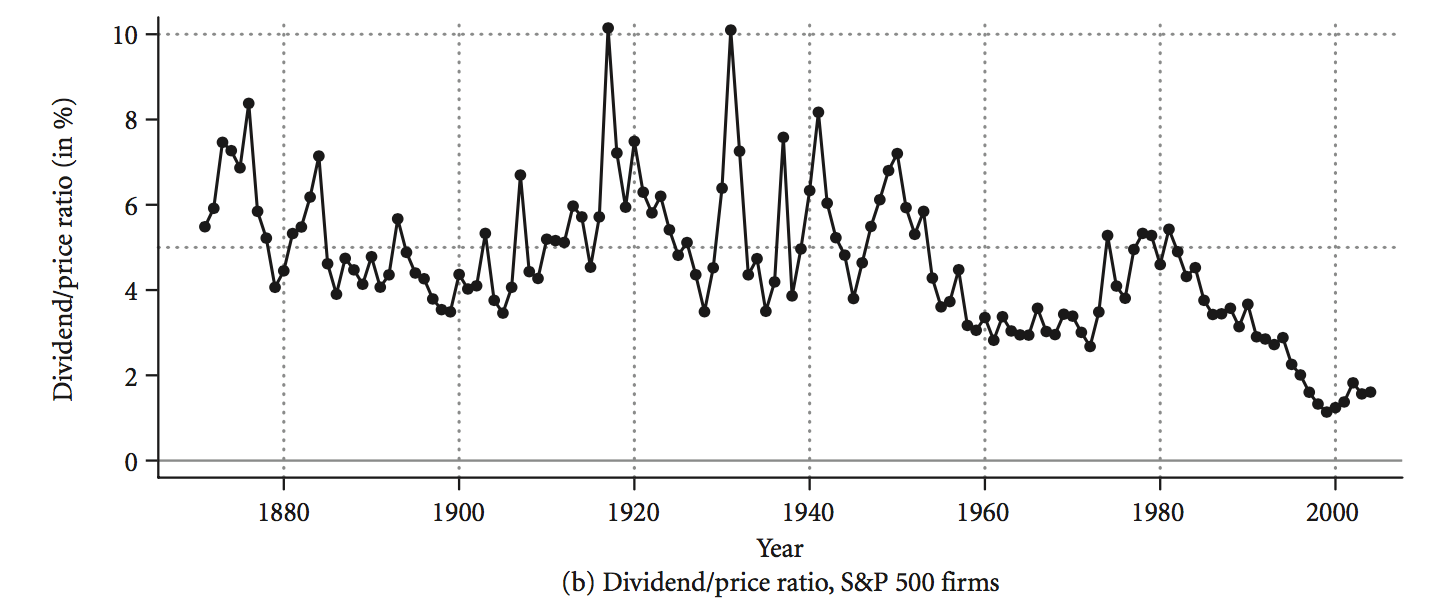
b.) The dividend yield (dividend per share divided by price per share) has gone down progressively, especially post 1980 to the current average of less than 2%, as illustrated by graph (b) below. This corroborates graph (a) as the P/E (Price-Earning) ratio has also increased over time. Go through the exact way in following representation.

c.) Dividend payout itself has seen two distinctly contrasting phases in recent times.
The rise of technology and growth firms since the late seventies mainly led to a trend of no dividend payouts almost till the mid-2000s. During the raging nineties, many high-tech companies had no profit to pay out dividends but offered capital gains, which coupled with the fact that dividends were taxed higher, contributed to many investors investing in these companies. Stocks of these companies were also higher and these started a trend of even other companies refraining from paying dividends.
This was in contrast to the earlier years when firms paying dividends held higher stocks than those who did not, and in turn encouraged more firms to do so. This fluctuation in the propensity to pay dividends has been explained in detail by Baker and Wurgler in their 2003 paper for the “Journal of Financial Economics”. A 2001 paper by Fama and French also document a shift in dividend policy between 1978 and 1999, falling from 67% to 21%.
When the IT bubble burst in the year 2000, this trend started to reverse. Investor mindset, spurred on by George Bush’s tax cut on dividends changed favorably towards firms paying dividends. Eventually the surviving technology firms also started toeing the dividend line.
When Microsoft announced, in 2003, that it would pay dividends, it confirmed the maturing psychology and culture of the technology firms. Consequently, the numbers went up with 25% of the firms paying dividends in 2004, up from 17% in 2000.
Dividends vs. Buybacks
While buybacks were only a low 13.1% of dividend payouts even in 1980 and stood at only 4.8% of the earnings, a number of factors contributed to buybacks growing at a phenomenal rate over the next two decade, so much so that it amounted to $181.8 billion in 1998, exceeding dividends which stood at $174.1 billion.
The primary reason, also pointed out by the Grullon and Michaely paper, was the 10b-18 ruling by the Security and Exchange Commission in 1982, which offered the firms a safe zone for buybacks as long as they adhered to the four clauses of the rule.
This was compounded by additional tax penalty on a firm’s cash reserves. It was not a surprise that the very next year, buyback spend increased threefold and continued to rise at 28.3% right up to 1998 when it stood at 50.1%. All of this took place while dividends were growing at 7.5% only.
Total Net Payouts (Dividends, repurchase along with equity offerings):
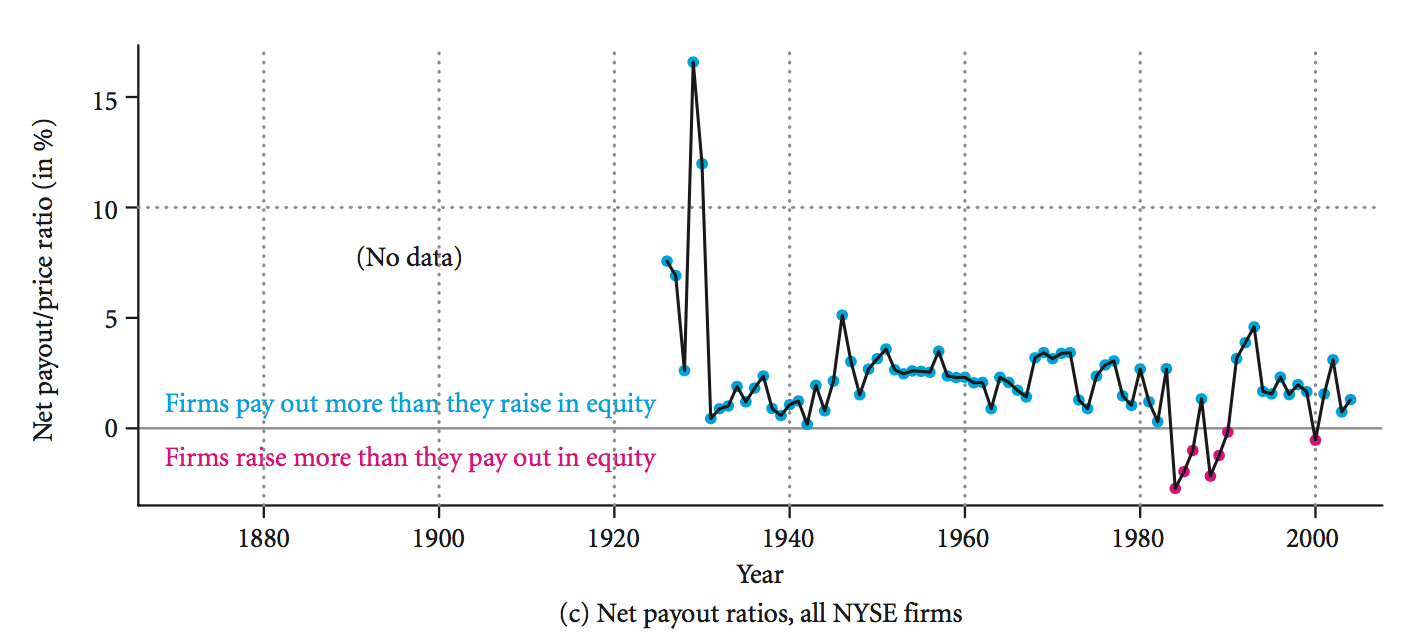
In contrast to dividends and buybacks, a company could also issue new stocks for public sale which are called equity offerings. Even in the absence of any strong trend, as illustrated by graph (c) below, we can see the 80s was the only period
where raising capital gained momentum and was higher than payouts. Before and after the 80s payouts have been higher than equity raising, with two noticeable spikes in the two years (1929 and 1930) after the great depression. So we can say that over the years, payouts being higher than equity offerings have been par for the course.
Market reactions
Reactions to the announcement of dividends can be viewed with respect to different parameters.
a.) Type of dividend
This could be dividend continuations or dividend initiations. The former would not rake up too much excitement as supported by a share price increase of only 15 to 20 basis points unless the firm has substantially increased its dividend yield – 10 basis points as a benchmark – in which case, the price goes up by around 60 basis points. For dividend initiations, the increase would be remarkably higher at 300 to 400 basis points.
b.) Size of the firm
Although the jury is still out on whether small firms ($30 million or less in market cap) should issue dividends only if they do not have better opportunities to reinvest, it is true that response to these dividend declarations have brought about an increase of 37 basis points as compared to large firms ($8 billion plus) for which the number was 14 basis points.
Response to Declaration
In the same context, it would be interesting to understand the average response to any dividend increase announcement, without distinguishing the type of dividend or the size of the firms which have made the announcement. The graphs (a) and (b) of Figure 19.3 are representative of 200,000 dividend initiations.
While Graph (a) illustrates an average rise of 24 basis points around day zero (declaration day) and day one,
Graph (b) breaks it down, where we can see that the rise for individual firms could be higher or lower than the average and there could be firms which, for a number of possible reasons, could even experience a drop of unto 500 basis points. This is as per an ideal stock market where the response is visible more on the declaration date – or even better, before that – as opposed to the ex-dividend date, which is the cutoff for earning dividends.
A lot of factors matter and differentiate between one point to the other. Like the classic chicken and egg paradox, it is a question of whether a dividend promises a better future or reflects a solid past. Bernardy, Michaely and Thaler suggest that it could be both as one, implicitly relies on the other.
Unless a firm has flourished, it won’t be in a position for a payout and it will pay out only if it has confidence in the future prospects. In reality, other than a prosperous future, dividends could indicate a number of things like lower market risk. Although once can argue that dividends should be more of a commentary on the future, the overwhelmingly positive reactions to a dividend announcements seems to indicate the market’s faith in the past.
Dividend Arbitrage:
In a perfect market, a dividend on a share is neutralized by an equal drop in the share price, although a small gain of few basis points is likely, as shares with dividends will acquire more value. So a $50 stock paying out a $1 dividend will trade at $49 the following day but if the price falls to about $49.10, then the profit would be 10 cents.
In the real world though, taxes on dividends can be high. Investors have devised clever methods to avoid or sidestep these taxes. Dividend arbitrage is commonly resorted to by investors with higher tax rates, often reducing it by 10% or lesser. The thumb rule for this kind of a transaction is that investors with higher tax rate will sell and the ones with lower tax rates will buy. The tactic involves selling the dividends to a third party institution with a lower tax rate or exempt from taxes when the dividend is to be paid out. Once the dividend is paid out and the dust settles, the shares are bought back.
This deal makes money for all the parties involved. According to the Economist, shares and bonds worth $1.5 trillion go through this kind of a transaction at any point in time in what was commonly referred in the UK to as “bed and breakfasting” or “bond washing”. Considering the $50 stock again, in a perfect market, it would sell at $49 after the dividend. In a real scenario, considering, for example, the stock sells at $49.50, it would create a neutral situation for an investor with 50% tax liability.
Any investor with more than 50% tax liability would end up losing 10 cents per stock, as the dividend after tax would be 40 cents. But if he sells the shares to an institution exempt from tax on cum day and buys it back the day after ex-day, he can avoid the tax on dividends. The Institution which buys at $50, gains a dividend of $1 per stock and sells at $49.50 also gains 50 cents per stock. So, it is a win-win situation for everyone.
However, regulatory bodies like IRS have brought in rules to reduce these arbitrages, in the absence of which taxes could have been potentially nullified by wily investors. Assuming as we did earlier that the return on a share with dividends is close to zero, the effective tax rate on dividends is represented by the formula below
For example, a share drop is from $50 to $49.50 it indicates a tax rate of 50% for the investor
This tax rate in a way also represents the inability of the tax-exempt institutions to take full advantage of tax arbitrage. A number of reasons like fewer number of such institutions, fear of being watched by regulators and the principle of investing diversely could possibly be behind this.
Tax Rates
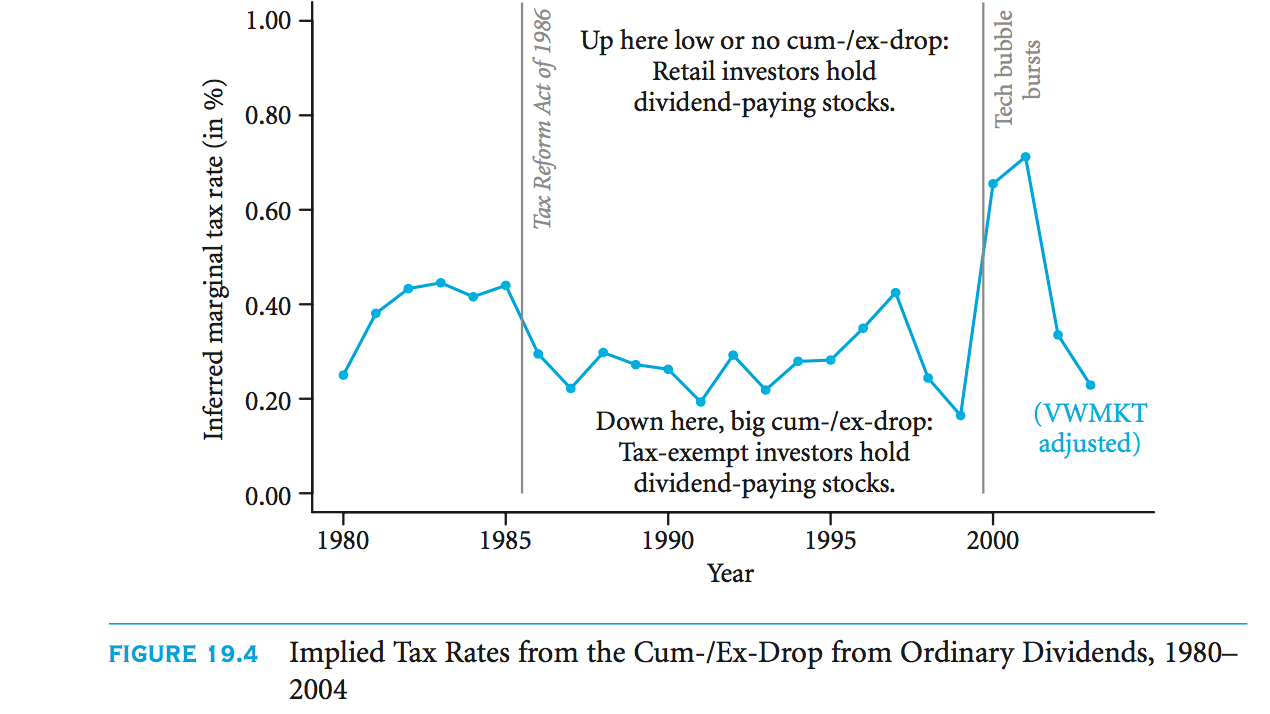
As seen in the above figure, the marginal tax rate was always tending towards the personal income tax rate and not towards the figure zero. Only after the Tax Reform Act in 1986 did it drop to 25%. Else it had always been hovering at around 50% and started creeping up towards the same figure again in tandem with the rise in personal income tax rates under the Bush Administration and Clinton’s first term. The IT collapse of 2000 saw the taxes spike abnormally but the Bush dividend tax cuts brought it back to around 20% by 2003.
Another interesting phenomenon to be noted from the graph is the propensity of retail investors to retain stocks with dividends post the IT collapse of 2000, in spite of the abnormally high taxes. This was in direct contrast to the nineties when these same investors seemed not much interested in these dividend paying stocks and opted for non-dividend technology stocks instead.
However, the drop in price of a stock from cum to ex is not just because of the marginal taxes, but, this trend of collecting in a positive return by selling on the cum-date, and buying on the ex-date exists in countries with zero taxes on dividends. The subject remains open to analysis.
Let us now analyze the immediate impact of the various kinds of announcement on the market.
Buybacks
Although buyback announcements are not as clear and certain as those of dividend payouts and neither do they point towards cash flow permanence, the larger size of buybacks as compared to payouts probably garners a stronger response from the stock market. This is typically true of large auction buybacks which can lead to a 15% rise in stock prices.
Stock Splits and Dividends
Stock splits and dividends are merely a reorganization of a firm’s wealth. It increases number of shares and the stock trades at a lower price but it brings no gain for the owners or investors. Although the expected response to such an event is none, there is in reality, a positive response to a stock split and a higher assessment of its NPV. The firm on its part has been seen to bring greater earnings post a split. A reverse split, in which two shares will merge to form one with double value, has a contrasting response and results in a share price drop.
A long-term impact of such announcements is not expected in an ideal market as all information is assumed to be available at the declaration. However, over a period, firms which pay out via dividends and repurchases have had market values higher by 10% than those which decreased dividends. However, these firms have also shown higher earnings which is as per expectations.
Questions:
- If there is no drop in stock price what is considered situation in regards to tax rates?
- If there is a value created by stock rate, what is the scenario?
- The manner in which stock price announcements respond to condition of initiation of dividends – what type of reaction can it be considered?
Links of Previous Main Topic:-
- Introduction of corporate finance
- The time value of money and net present value
- Stock and bond valuation annuities and perpetuities
- A first encounter with capital budgeting rules
- Working with time varying rates of return
- Uncertainty default and risk
- Risk and return risk aversion in a perfect market
- Investor choice risk and reward
- The capital asset pricing model
- Market imperfections
- Equity payouts
- Perfect market irrelevance
- Dividends and share repurchases
Links of Next Financial Accounting Topics:-
- Survey evidence
- Summary in equity payouts
- For value financial structure and corporate strategy analysis
- Capital structure dynamics firm scale
- Capital structure patterns in the united states
- Investment banking and mergers and acquisitions
- Corporate governance
- International finance
- Options and risk management


