It is very difficult to take decisions regarding statistical population which should be calculated by taking as base of sample observations. In order to reach at particular decision, we have to make a statement of population which is known by the name as statistical hypothesis.
For example
- The average marks of the students in a school is 77%
- The average lifetime of a certain wires is at least 25,000 miles
- Difference of resistance between two types of electric wires is 0.025ohm,etc
The hypothesis which is considered for test for possible rejections are subject under the assumption is known by the name as Null Hyphothesis. This null hypothesis is denoted by H0
For example,
H0 : µ = µ0, or, H0 : µ1 – µ2 = K, H0 : σ2 = σ0 etc.
Among different hypothesis if in Null hypothesis if any other hypothesis is taken in complementary form, then it is known by the name as Alternative hypothesis which is denoted by H1
For example,
H1 : µ > µ0, or, H1 : µ < µ0 or H1 : µ≠ µ0 etc.
Then we should move for the next step of setting up of statistic. When we accept or reject hypothesis we do two types of errors which includes
Type I Error shows:
Reject H0 when it is true.
Type II Error shows:
Accept H0 when it is false.
If we consider
P [ type I error] = α,
P [ type II error ] = β
then α and β are referred to as producer’s risk and consumer’s risk respectively.
Critical region
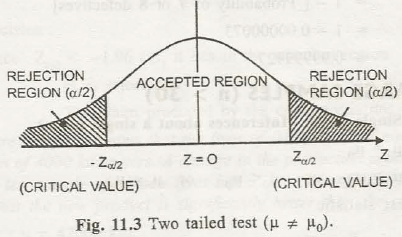
A region which is corresponding to statistic which leads to rejection of H0 is known as critical region or rejection region.
Level of significance (α)
This is a kind of probability in which random value of the statistic is of critical region. In simple words we can say that it is the main size of the critical region.Level of significance can be taken as 5 % or 1%. I.e. a = P [Type I error].
Critical value
Separated value of the critical region along with its acceptance region is termed as critical value which is adjusted by looking the alternative hypothesis.
Type of tests
Determination of this test is based on the alternative hypothesis
For example,
If H1 : µ > µ0 then it is called right tailed test.
If H1: µ < µ0, then it is called left tailed test.
If H1: µ ≠ µ0, then it is called both tailed test (/two tailed test).
Simple and composite hypothesis
If all the values are completely specified, then the hypothesis is called simple hypothesis, e.g., µ = µ0 , σ = σ 0
If not, then it is termed as composite hypothesis. e.g., µ< µ0 ,σ > σ 0 etc.
Steps in testing hypothesis: 1212
- Set up H0.
- Set up H1.
- Set up of statistic test
- Setting up of level of significance along of critical value(s) which are using statistical table.
- Computation of statistic value by using sample which is drawn from population.
- Taking of decision. Value which is calculated lies in critical region states rejection H0 where the value of null hypothesis is not accepted. On the other hand if the value lies in accepted region it states acceptance of H0.
Power function of the test
Let β = P [Type II error ]. 1 – 13 is called power function of testing where H0 is against H1.
Example 1
The fraction of defective items in a large lot is P to test H0 : P = 0.1, one considers the number of defectives in a sample of 8 items and accepts H0 if the number of defectives is less than 6. Otherwise he rejects the hypothesis. What is the probability of type I error of this test? What is the probability of type II error?
Solution:
If the Given H0 : P = 0.1.
Accept H0 : If the no. of defectives found in the sample is less than equal to 6.
Reject H0 : If the no. of defectives found in the sample is 7 or 8.
Here, the no. of defectives in a lot follows binomial distribution with n = 8 and P = 0.1,
Q = 1 – P = 0.9.
P [Type I error] = Probability of rejecting the H0 whenever H0 is true
= Probability of 7 or 8 defectives
= (8, 7) p7Q + (8, 8) QQ
= 8 (0.1)7 (0.9) + (0.1)8
= 0.00000073.
P [Type II error] =Probability of accepting the H0 whenever H0 is false
= Probability of defectives which are less than equal to 6
= 1 – [Probability of 7 or 8 defectives]
= 1 – 0.00000073
= 0.99999927
Links of Previous Main Topic:-
- Introduction to statistics
- Knowledge of central tendency or location
- Definition of dispersion
- Moments
- Bivariate distribution
- Theorem of total probability addition theorem
- Random variable
- Binomial distribution
- What is sampling
- Estimation
Links of Next Statistics Topics:-
- Statistical hypothesis and related terms
- Analysis of variance introduction
- Definition of stochastic process
- Introduction operations research
- Introduction and mathematical formulation in transportation problems
- Introduction and mathematical formulation
- Queuing theory introduction
- Inventory control introduction
- Simulation introduction
- Time calculations in network
- Introduction of game theory


