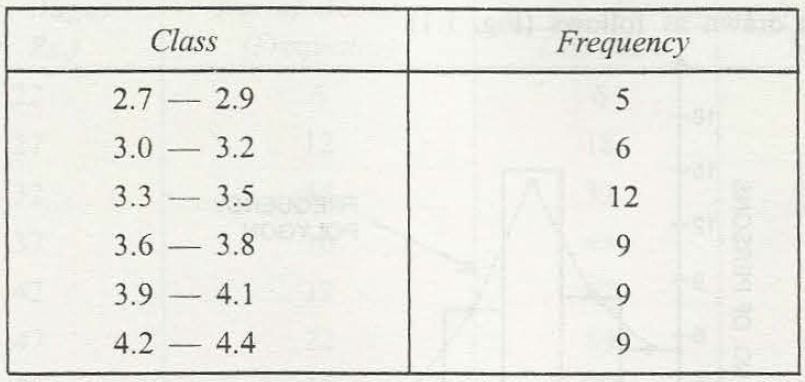
Statistics needs proper steps to solve out the problems and Frequency is an important term. Frequency distribution of data deals with the proper tabulation and this tabulation depends completely on proper experiments or observations. The exact way of distribution is arranged in a proper way either ascending way or in a descending way.
Proper explanation with example
Different numbers are provided suppose the marks in Mathematics of 50 students. It may happen that the paper was not difficult and thus the student obtains 80 % -100%. Now, it becomes essential to know about the number of students more than 80%. If the number obtain by 7 students is 85, then the frequency for that number is 7.
For small data records frequencies can find out easily. But, it becomes difficult for an observer to know about the proper data records for a larger amount. For a particular case when number of students is more than 50 or 100, then proper number of students or a group is considered as a class to find out the frequency. If the data needs for 100 people, then frequency can be done by creating group as 1-10, 11-20, 21-30 and so on.
In case of getting percentage of students the same structure requires to follow. Now, it is very important for students to have groups and then arrange in a proper way. Suppose, for passed students, 41% – 50.9%, 60% – 80.9% and 81% – 100%. In this the student needs to know that value in the left side is known as lower class limit and the value in the right side is known as the upper limit of that class.
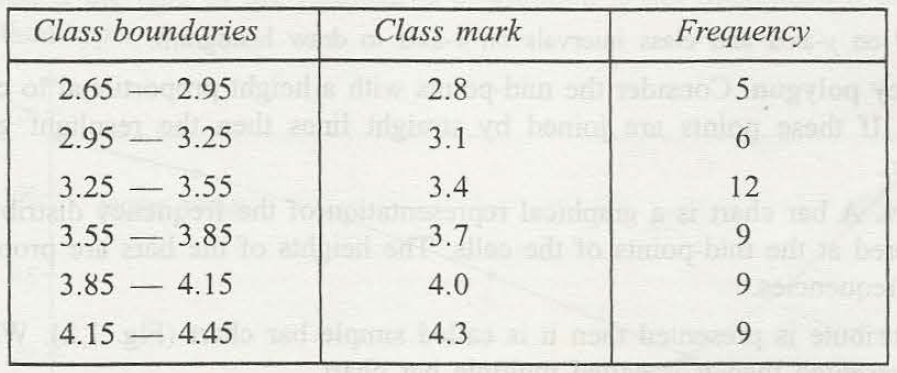
There are different examples in which the class is taken as continuous class and thus it can easily be written in the continuous format in which there must be a proper difference between an upper limit and a lower limit. A particular number as .05 or any other that makes it perfect, is added to the upper limit and subtracted from the lower limit to get a proper difference.
It must be followed in the class boundaries and frequency can easily get deducted in that way. However, in every class boundary there is a middle value and this middle value is known as class mark. When you go through a particular problem and you have class mark, the difference between the continue two class mark is always same.
Link of Previous Main Topic:-
Links of Next Statistics Topics:-
- Knowledge of central tendency or location
- Definition of dispersion
- Moments
- Bivariate distribution
- Theorem of total probability addition theorem
- Random variable
- Binomial distribution
- What is sampling
- Estimation
- Statistical hypothesis and related terms
- Analysis of variance introduction
- Definition of stochastic process
- Introduction operations research
- Introduction and mathematical formulation in transportation problems
- Introduction and mathematical formulation
- Queuing theory introduction
- Inventory control introduction
- Simulation introduction
- Time calculations in network
- Introduction of game theory


