After understanding the key terms in finance, you will make better comprehension now if you take a look at the financial statements of PepsiCo. You will find that whatever you have learned about calculation of different values are being implemented here. But there are also some terms which you still haven’t learned. But what we have achieved till now is a good understanding of the key logics behind the calculations. Also you need not make the records yourself as it will be the job of the accountant. If there are some terms which you still don’t have a clear idea, you need not worry. Almost all corporate firms have their own terms in the financial statements. With experience and practice, you will learn to improvise and understand on your own what those terms means.
Two items which haven’t been discussed yet but recurs commonly in financial statements are- investment in good will and miscellaneous increase in other assets. Investment in goodwill is not what it sounds like; it is the term used to refer to the cash laid out when one firm acquires another firm. You will not find this section in PepsiCo’s financial statement as they didn’t make any significant acquisition in that year.
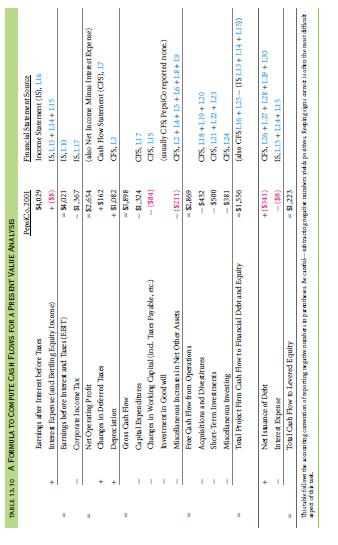
If you look at the table 13.10, you will notice that it has been made by putting together long term and short term accruals along with other items. It can be used for an NPV analysis. As you can see that $1556 cash flow is generated from PepsiCo’s projects. That is divided between shareholders and creditors. Shareholders earn inflows from the new debts which are issued. They pay interest as well as principal. Net issuance of debt is the term used to describe repayment of principal along with the new debt.
It will be foolhardy to assume that the formulas discussed here are the end-all formula to compute cash flows for every company. Cash flow calculations for different companies vary. Here certain items were ignored for the understanding of PepsiCo’s financials. But it provides the basic platform for you to understand and calculate cash flows for NPV analysis. It also provides a beginning to realize the complex link between cash flow and earnings.
Important:keep in mind that finding out cash flow for NPV analysis is easiest from the accounting cash flows. The accounting statements provide easy means of extracting cash flows. The only thing you need to keep in mind is that accountants consider an interest as cost necessary for conducting business whereas a financier considers it a capital payout.
Wall Street analysts often use the following formula for calculating free cash flow:
Free cash Flow = EBIT – Taxes + Depletion & Amortization & Depreciation – Capital
Expenses – Increase in working capital
If you are considering of acquitting a company then this simplified formula helps you understand how much you can get out of the company by ignoring the small items like deferred taxes.
One good thing is that sometimes you need not perform the complex calculations using the long formula. When a firm reports its complete financial statements, then the cash flow statement reported can be utilized to make the necessary NPV analysis. The cash flow statements generally contain two types- operating cash flow and investment cash flow. With the two values you can make the necessary calculations without having to worry about the long formula and working with the separate components. But one thing that you need to keep in mind is that the difference in what financiers considers as cash flow and accountants take on cash flow. For example interest payment is considered as necessary expenditure by the accountant while a financier considers it a repayment to firm’s financiers.
When we apply the formula to the financial statements of PepsiCo we find the following Project cash flow:
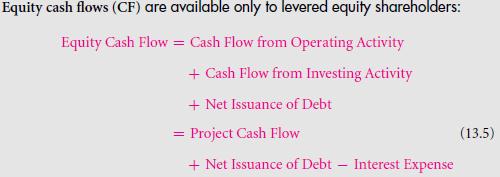
It is interesting to note that PepsiCo didn’t pay any interest income but instead they earned interest income in the year 2001. In order to find the Equity cash flow earned by PepsiCo, you need to add back the net issuance of debt. What is this value? It is the difference between debt principal raised and repaid. The formula is:
So as you can see that the above values are equal to the ones that we calculated with the help of the long formula. But it doesn’t mean that you can use this simplified formula all the time. If you are unaware of the discount rates being applied, then you need to work out individual components with the long formula.
In the years 1999 to 2001, PepsiCo showed an increase in net income. But a closer look will tell you that the cash flow dropped from 2000 to 2001. What the managers did in the year 2000 is that they made use of the changes in working capital and thus masked the drop in cash flow. You can refer to table 13.4 to know how PepsiCo invested their project cash flows like dividend payout, equity and debt repayment, etc.
To sum it up, when you go through these figures, you will see that PepsiCo had a total market expenditure of $1919. So basically they paid $355 more than they made in the year of 2001.
This is where we conclude our discussion about cash flows for NPV analysis. Hopefully you can utilize the knowledge you gained to perform NPV analysis of your own.
Note: All dollar values used for PepsiCo’s financials are in millions
Links of Previous Main Topic:-
- Introduction of corporate finance
- The time value of money and net present value
- Stock and bond valuation annuities and perpetuities
- A first encounter with capital budgeting rules
- Working with time varying rates of return
- From financial statements to economic cash flows
- Financial statements
- A bottom up example long term accruals depreciation
- Bottom up example deferred taxes
- Bottom up example short term accruals and working capital
- Earnings management
Links of Next Financial Accounting Topics:-


