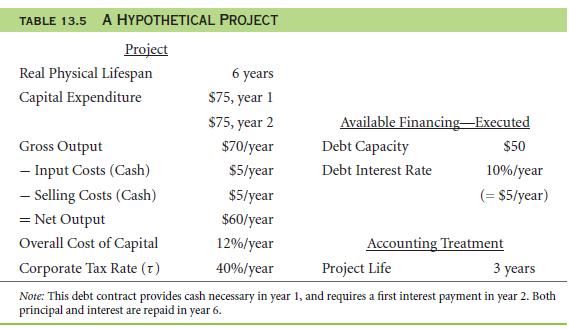
Before we venture into the financial statements of PepsiCo, which is a huge corporate company, it will be simpler to begin with a simple hypothetical project of our own. Say you own a firm that has only one operating machine. The machine has a durability of 6 years, it doesn’t require any maintenance cost and it costs a capital spending on both first year and second year. It is capable of producing full time outputs from the very first year. It provides an average sale of $60 per year. The income tax levied on your company is 40% and the capital cost percentage amounts to 12%. Also it is assumed that you company is in a debt of $50 with an interest rate of 10%, and your annual interest payment value is $5. With all these hypothetical parameters, we will take a look at the financials.
13.2 A Doing Accounting
In real life, it is almost impossible to match actual life with accounting parameters. This is because no one can assertively say what an asset life will be. This gulf between real life and accounting life is more predominant when it comes to taxes. The depreciation rules used for calculation of taxes are set by the Congress and they follow a strict schedule which doesn’t take into consideration asset life. These tax laws vary from state to state. In real life GAAP and IRS uses different schedules but for the sake of your understanding assume that both have stated that your machine is to be depreciated over 3 years. Hence a cost of $75 will result in $25 depreciated price over 3 years. After the third year there is no more depreciation. All these affect the financial report which is depicted in the following tables. You might find a lot of new jargons while going through the table. Some of them are- COGS (cost of goods sold), SG&A (selling, general & administrative expenses). When these two expenditures are subtracted from the value of sales we get EBITDA (earnings before interest, taxes, depreciation and amortization). Upon subtracting the depreciation from it we get EBIT (earnings before interest and taxes). From EBIT we can calculate the net income or simply the earnings by subtracting the interest rate and the income tax. Net income is the final value that we arrive to.
A closer look into the financial statements of this hypothetical project and the one provided for PepsiCo will tell you that both of them are fundamentally similar with a few differences. From table 13.3 we can see that PepsiCo’s sales were $26,935 million. Subtracting SG&A, COGS, Amortization provided an EBIT of $4,021 million. After bottling equity and other factors, the net interest income of $8 million was calculated. From there tax of $1,367 million was paid leaving the shareholders with a net income of $2,662 million. With PepsiCo being such a huge corporation, it is quite imminent that their financial statements will contain certain extra items in their financial statement, but fundamentally our hypothetical financials and their financial statement are the same.
The income statement of the hypothetical finance contains almost all the necessary information regarding the project. The only thing left out from there is the capital expenditure and the net debt. These two are not incorporated in the income statement but rather in the cash flow statement. As we know, the capital expenditure is $75 for the first year, and also $75 for the second year with no additional expenditures in the following years. The net debt of $50 issued on the first year, is repaid on principal on the sixth year.
Why is capital expenditure not reflected in the income statement? Do they not affect the income? Yes capital expenditure reduces net income, but slowly in depreciated manner over the years.
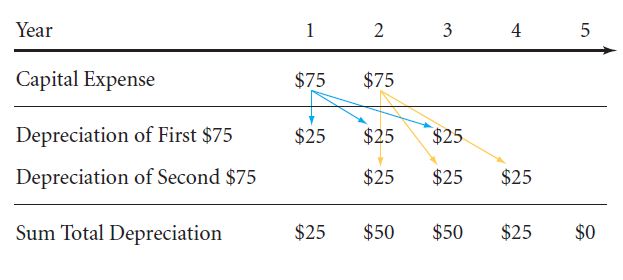
The capital expenditure is depreciated in the following way:
Year 1: $25 from the first capital expenditure is taken into account
Year 2: the second installment of $25 for the first capital expenditure followed by the first installment of 25$ for the second capital expenditure.
Year 3: the final installment of $25 of the fist capital expenditure followed by the second installment of $25 for the second capital expenditure.
Year 4: first year expenditure’s depreciation is complete. Only the third and final installment for the second capital expenditure is taken into account.
It is depicted in the following table:
13.2 B Doing Finance
In order to see the firm through a financier’s perspective you need to consider three elements- the machine, the tax that has to be paid and the loan itself. The relation can be described as follows:
NPV Project = NPV Machine – NPV Taxes
NPV Levered Ownership = NPV Machine – NPV Taxes + NPV Loan
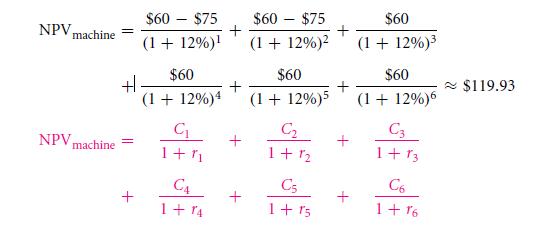
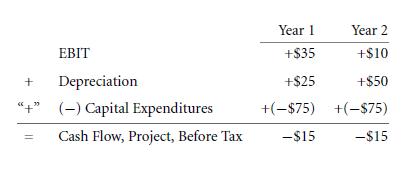
There is a difference between being a full time owner of a project and being a levered equity owner. As a full time owner, you will have both the machine as well as the debt. As a full time owner, you need to worry about paying a lender at the first year. But in the following years, there is no need to worry about repaying debts. Let’s take a look at the cash flow of a machine without calculating taxes or loan.
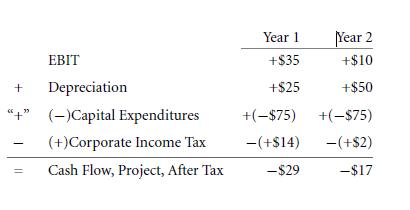
Another important component while calculating machine cash flows is corporate tax. From table 13.6 you can see the tax being collected is $14 during first year followed by $2 two times and $12 and then again twice $22. For the sake of understanding if the tax discount is taken in accord with the cost-of capital which is 12%. With this discount factor you can now calculate the current tax obligation which is
Now we arrive at our third component for calculating NPV project that is loan. If you are a levered equity owner and not a full time owner, then your loan will be associated from a capital market. If the company received its fair share of return for its investment then a loan paying $50 every year at an annual rate of 10% will have zero NPV.
Hence this means that the NVP project with the loan is same as project without loan. This simplifies the scenario
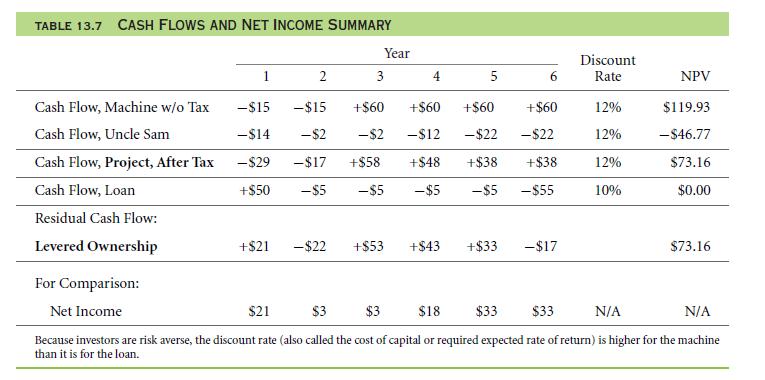
It is interesting to note that even though the NPV remains unchanged, cash flow and net income are way different from each other. It is clearly depicted in table 13.7 where it can be seen that where the cash flow is highest, the net income is lowest and where the net income is highest, the cash flow is negative.
13.2 C Reverse-Engineering Accounting into Finance
You might be wondering how reverse engineering could fit into finance. Well, here reverse engineering refers to the process of back calculation required to calculate the firm value of a firm. It is not possible to calculate the value only with the knowledge of financials by discounting the net income with cost of capital at 12%. Neither can it be calculated correctly with cost of capital at 10%
So how can you successfully calculate NPV from financials? The only process is through reverse calculation. Through reverse calculation the financials are converted back into cash flows. These cash flows are necessary for NPV analysis calculations. All the data are available, you only need to know how to extract them and put into use. To get the machine cash flow the following formula is applied:
This formula logically undoes the work of the accountant of laying out the machine cost over a certain time period. That is why the depreciation is added back as it is not the actual cost and the capital expenditures are subtracted which are considered as the actual costs. Next you need to deduct the corporate taxes that had been levied. It might confuse you to note that at some point taxes are assigned negative values while at some points it is assigned positive value. After adjusting the tax, the required cash flow is obtained.
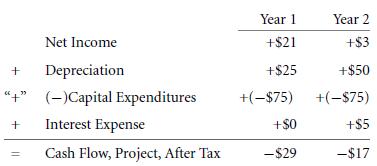
If you are not comfortable with the above described method of obtaining cash flow, another method of doing so is through net income. This is because net income is the sum after deducting out income tax; hence you only need to deduct the interest to get back the cash flow. It can be done in the following way:
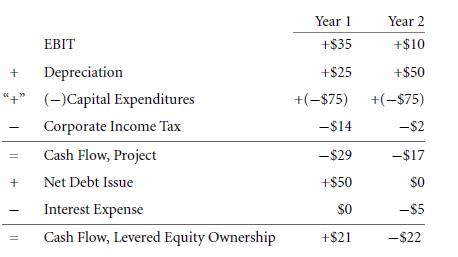
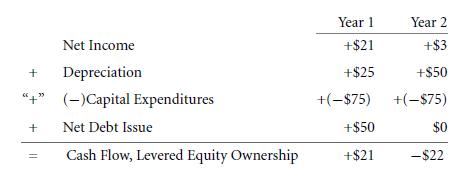
The above calculations provide the same result hence any method can be utilized to obtain cash flow. The figures tell us that the investors, debt and equity put together, needs to come up with $29 in the first year and $17 in second. Now you need to calculate in terms of a financed expenditure, what part has been borrowed and what part you need o pay on your own. If the creditors provided a sum of $50 and they got back $5 in the second year, then the cash flow is a positive value of $21 in the first and negative $22 in the second. Therefore to generate the cash flow, add the principal of loan as inflow and subtract the loan outflow which consists of both principal as well as the interest. The cash flow can be viewed as follows:
The above calculations can be done with net income too; it will generate the same result.
13.2 D Depreciation Nuances
You have already learnt that depreciation is not something you read from cash flow and no income statements. To understand why, you need to know more in details about depreciation and its types.
There are basically three types of depreciation- depreciation, amortization and depletion. Their similarity lies in the fact that all of them are just allocated costs and not actual cash flows. Their difference lies in the fact that they are applied on different kind of resources or assets. While depreciation is applied to tangible assets, depletion is applied to natural resources and amortization is applied to intangible assets. If you do not know what intangible assets are, they are basically assets which are not physical in nature, but they are intellect properties such as copyright or patents, etc. while intangible assets only constituted 10% of public traded US firms, today they constitute majority of the assets.
Since all three forms are conceptually same- depreciation, depletion and amortization, they are grouped under the same term that is depreciation. But you still dint get to know why depreciation is not calculated from income statements and only read from cash flow. The reason is, while making our hypothetical finance statements, you will notice that from the income statement it is not possible to judge what depreciation we allocated for the machine. The corporations can divide the depreciation and put it under COGS or SG&A. this is more convenient than stating the depreciation in a separate statement. Plus it doesn’t affect the outcome of the income statement figures in any way. If you go through the income statement of PepsiCo, you will find that they had put the depreciation under SG&A. the only depreciation that has been stated is the amortization of non physical assets.
So, can you find out the actual depreciation figures from the net income statement? The answer is no. it is only possible by reading it from the cash flow statement.
Links of Previous Main Topic:-
- Introduction of corporate finance
- The time value of money and net present value
- Stock and bond valuation annuities and perpetuities
- A first encounter with capital budgeting rules
- Working with time varying rates of return
- Uncertainty default and risk
- Risk and return risk aversion in a perfect market
- Investor choice risk and reward
- The capital asset pricing model
- Market imperfections
- From financial statements to economic cash flows
Links of Next Financial Accounting Topics:-


