General Mills, Inc., an American multinational manufacturer and distributor of consumer foods came up with an idea of a new breakfast cereal. It was a sweet and classic dish, the Apple-Cinnamon Cheerios. However, before this product hit the market, the firm had to find answer of a very crucial question. That was:
How much should they charge for it?
It is not only about the General Mills Inc. In fact, this is the most crucial question for any company. To carry out the solution to this question, General Mills conducted a well-organized analysis of the consumer tastes to get an insight of the demand. There was even a more complex problem that the U.S. Congress faced while assessing the program on federal Food Stamps. In fact, the aim of the program is to provide food coupons to families whose incomes are low. However, the biggest problem that this program had is again to find out the solution of another problem, which is ‘How much practical is it to use food coupons for providing individuals with more food?’ This was because providing subsidy on the price of the food items could also have meet the same objective.
This can be attained with utmost accuracy by getting deep into corporate and public policies. Thus, an in depth knowledge of consumer behavior is necessary.
Consumer Behavior
One of the fundamental problems of microeconomics is to understand that, how consumers with limited income can makes a choice of products that she or he can buy. This problem will be addressed in this chapter as well as the others. This chapter aims at understanding the preferences that consumers make while allocating their incomes for various services and goods. This will also enable the readers to understand the demands that people have for products and how can a change in income or a change in prices affect the demand for services and goods.
There are three basic stages that determine consumer behavior. These are:
- Preferences of consumers: This stage aims at describing the reasons that enable people to prefer one product or service over the other.
- Constraints of money: This stage aims at taking care of limited income of consumers, which in turn poses a restriction on the quantities and types of goods that they can buy.
- Choice of consumers: With preferences and limited income levels, consumers make choices for the goods that provide them the maximum feeling of satisfaction.
These three stages form the very principles of consumer theory. These will be dealt in detail in this chapter. The readers will be able to find out the typology of consumer preferences by making certain observations.
A simple observation of things like consumer preferences can be made when a consumer prefers one item over another, even if the prices of both the items are same. This clearly indicates that the demand of both the items. Another observable behavior could be to notice the action of consumers towards change in the price points of several goods. There could be several such observable behaviors.
When the chapter will conclude, the readers will get back into the analysis of actual and minimal prices that was initiated in Chapter 1. The variation of consumer behavior can be understood quite properly by the usage of Consumer Price Index.
What do the consumers do?
This chapter aims at understanding the purchasing power thoroughly. This in turn is governed by, range of indices that affect the costs and usage of social-welfare campaigns. A lot of assumptions need to be made here. Not only this validity of the assumptions need to be checked at every stage. It is a difficult job to question consumers’ preferences when it comes to choice of goods and services, because there always resides the budget constraints. However, what potentially can be done is to extrapolate the consumers’ choice and as rational economics come up with propositions to suit their tastes as well as their pocket.
One thing to keep in mind is that, consumers do not always think logically before making any purchasing decision. Quite an often, consumers are found to buy items based on their mood without fully weighing the budget that their pocket allows. This in turn leads them to be under the condition of debt. At times, it may also happen that consumers make purchasing decisions without being sure of their requirement, but get influenced by the decision that they see others to make. These types of purchasing decisions are said to be irrational. The story doesn’t end here. Even if, the consumers think rationally, it is not completely possible to strict to the plans when they have an abundance of prices and products daily.
Economists worldwide, in consultation with psychologists are in the process of developing and deploying paragons regarding behavioral aspect of consumer that has an inclusion of more accurate conclusions about decision making. This field of study is known as behavioral economics. Some key aspects of behavioral economics will be discussed in detail in Chapter 5.
So, precisely it can be concluded that the basic paragon of consumer behavior make some necessary and realistic assumptions that help to simplify the further tasks. This paragon has so far remained a great success towards understanding consumer preferences and properties of consumer demand.
3.1 Consumer Preferences
The choices of services and goods that the industrial economy provides are immense. Obviously the need, the budget and the choices of every individual vary. In a scenario like this, how can we precisely define consumer preferences?
Let’s first try to understand the comparative mind of customers when it comes to making choices among the items that are available for purchase. Let’s try to find out if, one group of item is favored over another group, or will the purchaser stay neutral to both the groups?
Market Baskets
The words ‘market baskets’ is used when there arises a need to refer to a group of items that suits the taste of consumers the more over the other group. ‘Bundle’ is also a word that is means the same thing and is used by economists worldwide. A market basket can be compared to a shopping cart where selected items along with selected quantities are kept.
Word bundle is used by many economists to mean the similar aspect as market basket.
Remember to have the answers of the following questions ready.
- What makes consumers select the market baskets?
- What things do consumers consider, while planning the monthly budget?
- Is there any difference between the planning of monthly budget and the actual expenses of a month?
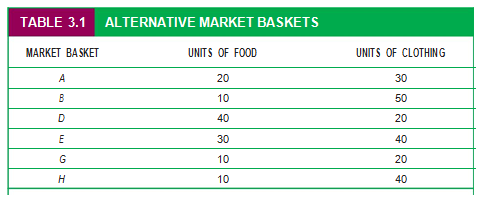
The data in table 3.1 indicates market baskets that contain certain quantities of clothing and food that are purchased in a month. The quantity of eatables can be measured by varying considerations such as number of packages, mass in grams or kilograms, number of containers, and so on, and so forth. Similarly, huge or less cloth quantity can be counted as number of sets or total number of piece.
Now, this method of assumption is quite random, and hence, we will consider the items in market basket as the number of units in totality of each item. For example, market basket labeled as ‘D’ comprises 20 units of clothes and 40 units of food.
Now, if we consider the purchasers’ preferences as regular, it is time to ask ourselves a question. That is:
Do consumers prefer one market basket over another?
The next portion of the chapter aims at obtaining the answer based on our assumption.
Some Basic Assumptions about Preferences
The paragon of consumer behavior is broadly governed by three fundamental assumptions. These assumptions are believed to be major reasons for people preferring one market basket over another. These are listed as follows:
Completeness – Preferences are by default considered to be complete. This means consumers can compare all market baskets and arrange them in order of their preferences. For any market baskets, let’s say, C and D, three cases can arise. Either a consumer will prefer C over D, or will prefer D over C, or may remain indifferent between the two. The later in fact means that he/ she is equally satisfied with both the baskets. When we are talking here about completeness, we are not including the cost factor.
Transitivity – This assumption can be understood by an example, where a consumer prefers basket B over basket C, and basket C over basket D, then the consumer will prefer basket B over basket C. Transitivity is believed to be a mandatory assumption to analyze consumer consistency.
More is satisfactory than less – Most of the articles that make up the industry are believed to be desirable. Consumers always prefer to have more and more of his/ her desires fulfilled. Consider an example of clothing, where a consumer first purchases the clothes, then go on for matching foot wear, even matching accessories. So, practically there is no end to the desires. The more is always what consumers want.
The above three assumptions form the fundamentals of the consumer paragon. They rationalize the things and arrange the consumer behavior logically. Having these assumptions with us, we will now set on the ride to find out more about consumer behavior.
Indifference Curves
Indifference curves are used to represent a consumer’s preferences and consider products in market baskets that give the feeling of satisfaction. The consumer is said to be at a state of indifference to two or more baskets that are indicated by plotting points on the curve.
By whatever we studied so far, we have an idea that a purchaser can prefer one market basket over another or stays indifferent to the both. This knowledge can be utilized to rank all imaginable choices of consumption. Let us try to indicate this information graphically. Let us consider clothing C and food items F are available for consumers. So, the corresponding market baskets explain the inclusion of clothing and food that a consumer wishes to purchase.
Suppose we have of some baskets that contain variety of clothing and food. Now, let us try to plot the consumer’s indifference curve.
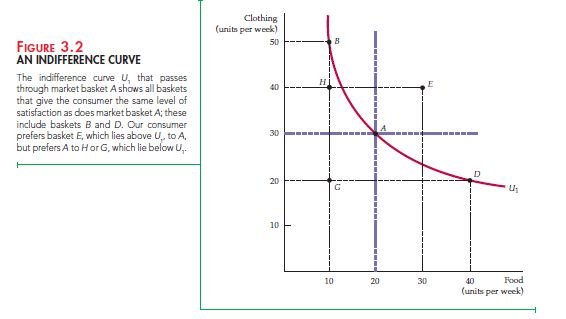
The number of food units purchased on a weekly basis is indicated by the horizontal axis, while the clothing units purchased on a weekly basis is indicated by the vertical axis. If the graph is observed carefully, we will notice that the market basket A, having 20 food units and 30 clothing units are preferred over market basket G. The reason can be understood very easily if we recall the third assumption (more is satisfactory than less).
Market basket A has more clothing and food. In a similar manner, the market basket E, is in turn preferred over market basket A. The reason is again the same. This way, two shaded regions depicting all market baskets can easily be compared because they either contain less or more of food and clothing units. Note carefully that, B has less food but more clothing units and D contains less clothing units but more food as compared to A. Without the knowledge of consumer’s ranking, it will not be possible to compare the market baskets A with that of H, D and B.
This clearly specifies that the purchaser stays indifferent to the three market baskets. This in other words means that the customer feels neither happy nor sad in obtaining 20 clothing units to giving up 10 food units. Also, the consumer stays unresponsive between points D and A. The purchaser in order to obtain 20 food units will give away 10 clothing. The consumer prefers A more than H that lies below the curve U1.
The indifference curve inclines down from left to right. Had this curve moved upward, it would be a case of violation of the assumptions. Market basket E is preferred over market basket A, because E has more food and clothing units. This indicates that, any market basket that lies overhead and to the right of insignificance curve U1 is preferred over any market basket on or lower than U1.
Indifference Maps
An indifference map is a collection of indifference curves.It demonstrates the preferential choices of a consumer. This preference is related to all the necessary arrangements which include clothing and food. On looking through an indifference map, all of its indifference curves demonstrates the market baskets. As per these baskets, every consumer stays in an average condition.
On looking through a graph which shows an indifference map, one can see the presence of three indifference curves which is formed on this map. This indifference curve, which is denoted by U3,highlights the maximum feeling of satisfaction to the consumers. This curve U3 is again followed by U1 indifference curve and U2indifference curve.
Let us see if the indifference curves in an indifference map can intersect or not.
For a moment, let us assume that the curves do intersect. Let us assume that there are two indifference curves. We named the first curve as U1 and the name of the second curve beU2. Both these curves are intersecting at a certain point A. let us also assume that there is another point apart from point A. we will name the other point as B. from the stated factors, both these points lie on the indifference curve (U1). In this case, the purchaser must be indifferent between the two different market baskets.
Now, on the same lines, we find point A and point D lie on U2 (indifference curve). As per this finding the consumer is unresponsive between these two (point D and point A) market baskets as well. By using the transitivity assumption, we may accept the fact that the consumer is indifferent between both point B and point D as well. However, in reality this assumption is not valid. The preference of market basket B is a must over market basket D as it has more units of clothing and required food. This clearly indicates that within one indifference map, indifference curves cannot be intersected. There can be presence of countless non-intersecting indifference curves. And it is also true that every potential market basket do have one indifference curve that passes through it.
The Shape of Indifference Curves
We have already seen that the curve slope of indifference curves is towards downward. In the example that we are taking everywhere, whenever there is an increase in the food unit along the indifference curve, there happens a decrease in the clothing units.
Downward sloping of indifference curves follow the assumption ‘More is satisfactory than less’. However, in a certain case, if one indifference curve inclines upward, it clearly indicates that a consumer remain indifferent. This un concerning attitude is between two different market baskets. Also, this indifference is despite of the fact, that one market basket has more of clothing units and food units than the other one.
As we have studied in an earlier chapter, there occurs a situation if trade-offs. The indication of the exact shape that can be seen in the indifference curve states the willingness that a consumer has over a certain good. As per it, a consumer is an eager participant who can easily substitute one of the commodities with other.
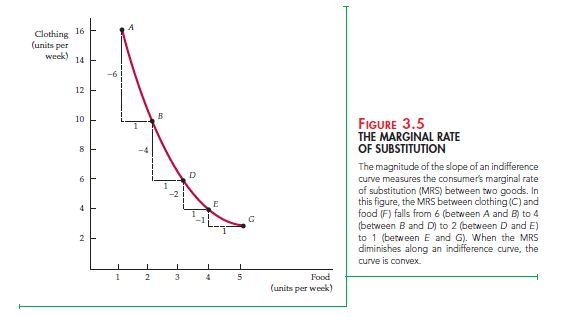
In a certain graphical depiction 2market baskets are mentioned. One is named as A and the other market basket named as B. Now, we can see that a certain consumer is ready to give away 6 clothing units for 1 extra food unit.
However, when he or she moves from market basket B to market basket D, the willingness changes to give away only 4 clothing units to obtain the same 1 food unit. Further when the consumer moves from market basket D to market basket E, the willingness constricts to 2 clothing units for 1 food unit.
It was then clearly noticed that a person who possessed more clothes consumed less food.Similarly, when that same consumer gave away more of his or her clothing, that person could acquire more food. So, standing on the same lines, it became clear that the more food a person has, the less is the clothing that he or she will require. That consumer will give away his or her excess clothing to have more food in stock.
The Marginal Rate of Substitution
The Marginal Rate of Substitution (MRS) signifies the quantity of one item that a certain consumer is ready to gives away in order to acquire another item at a larger quantity. Therefore, the marginal rate of substitution of food unit denoted by F is against the clothing unit denoted by C. This clearly means the maximum of cloth quantity one consumer is comfortable to give away for an additional food unit. If the MRS comes out to be 4, it indicates that the purchaser prefers 1 unit of food over 4 clothing units. Similarly, in case the MRS showcases its value as ¼, it indicates that the same purchaser prefers 1 unit of food over only ¼ units of clothing.
Thus, MRS can be stated as the measurement of a certain value that a consumer or purchaser can places on an extra item unit in lieu of another.
Let us consider a figure where the clothing units are represented on the x axis whereas the food units are represented on the y axis. While denoting MRS, we should have a clear concept which items we are ready to give away to acquire other item in more quantity. In this example, the vertical axis or the clothing units denote the units which one consumer is ready to leave for the other item.
On the other hand, the y axis or the food units denote the units that a purchaser wishes to have more and more. If in clothing units there are any change, it is denoted by ΔC and for the food units, the change is denoted by ΔF. With the help of ΔC/ΔF,MRS is denoted. ΔC is always negative since the consumer gives away the clothing units. In order to make the MRS sign positive, there is an inclusion on negative sign. The MRS thus, in terms of its magnitude, is equal to the indifference curve slope. For instance, the MRS between the two different points is 6. It is between A and B. This clearly indicates the compliance of that consumer to part with his or her 6 clothing units to have 1 additional food unit.
Convexity
In another figure, the MRS tends to fall as we decline towards the indifference curve. This decline signifies important characteristics of consumer penchants. In order to completely understand this aspect, we will include an assumption to the earlier list of three assumptions. This assumption is written below.
Diminishing the marginal substitution rate – Indifference curves are bowed inwards. That is why, they are referred to as convex. In the same figure used in convexity, if we start from market basket which is named as A and move on to market basket B. Similarly, we will be stating F for MRS of food units and C for clothing units. This way, it will stand as – ΔC/ΔF = (–6)/1 = 6 (positive magnitude).
However, if we start with market basket named B and move to market basket named D, we can find MRS to be only 4. Further there is a fall of 2 MRS when we move from market basket D to market basket E. As the quantity of food consumptions increase, the angle of the indifference curves sees a decline in its magnitude. Consequently, the MRS too declines.
Thus indifference curves are necessarily convex. When more of the items are consumed, a consumer will be willing to give away less units of the second item to acquire more units of the previous one. On proceeding with the indifference curve, we will observe that, the intake of food unit has increased, consequently, leading to higher consumer satisfaction that the person has by seeing more food will decrease. Thus the consumer will tend to give away less and less units of clothing.
One thing that is good to note is that the consumers prefer market baskets which is perfectly balanced over those that contain abundance of one item and none of the other item. Market basket D is relatively balanced to have 3 food units and 6 clothing units. On the other hand, the market basket A is an unbalanced one, having 1 food unit and 16 clothing units.
Perfect Complements and Perfect Substitutes
By now we know that the shape of one indifference curve determines a consumer’s willingness to exchange one item for another. A different curve shape indicates an unalike willingness for the substitute. Let us analyze a graph and consider two examples to understand this. In a certain figure, it shows how Bob prefers for apple and orange juices. Since, Bob remains indifferent between the two drinks; they are the examples of perfect substitutes. The MRS is 1 in case of apple juice over orange juice. Bob is ready to substitute a glass of apple juice over a glass of orange juice.
Two items are said to be the perfect alternatives when there is a constant MRS of one item with the other. Indifference curves that signify the substitution between items are in fact not curved, but straight lines. Also, it is not necessary for a perfectly substituted indifference curve to have the slope as -1. Let us assume a scenario where Bob thinks that one 32 MB SD card will be equal to two 16 MB SD cards. If a graph is plotted with 16 MB SD cards on the vertical axis, then, the inclination will be -2 in the indifference curve.
Now the same graph depicts another situation where Jane prefers left shoes over right shoes. In this example, the two items are a perfect complement of each other because the purpose of one will remain incomplete without another. Since, Jane is not ready to part with any of her shoes for any other; the MRS for this case is 0. So, the shapes of indifference curves are two right angles.
Short Comings
So far, we discussed all the cases which have advantages. These are all the cases where more quantity of an item is preferred over another which is less.
However, there are some disadvantages or bad things as well. These are the things where less is preferred over more. In order to account for these, the item is redefined and studied further to suite consumers’ tastes and preferences. With this consideration, all the four fundamental assumptions that we considered for the formulation of consumer paragon stay valid.
Utility
It is not always necessary to have a numerical satisfaction level to each market basket. The curve indicates that the market basket A (or for another market basket on the indifference curve U3) provides a feeling of higher satisfaction rate than any other market basket U2. The indifference curves takes into account consumers’ privilege to rank their alternatives.
Consumer paragons are built on the assumptions that consumers provide ranks to the respective market baskets. Quite times, it is also beneficial to allocate numerical standards to separate baskets. This leads us to explain consumer preferences by providing numerical scores to each level of satisfaction linked with all indifference curves. This technique is called utility. Utility is used by consumers to possess items that give them a feeling of satisfaction and not those that give them a sense of pain. Utility thus, simplifies the rankings of market baskets.
Utility functions
It is a specific formula linking to a certain utility level of each individual market basket. For example, let us consider a case, where(C) denotes clothing and (F) denotes the utility function for food. Utility function is u. So, u(F, C) = F + 2C.
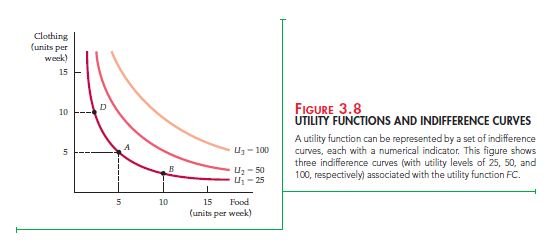
Thus, a single market basket containing 9 food units and 3 clothing units have a utility function of 9 + (2)(3) = 15. So, the consumer will remain unresponsive between this market basket (9 food units)and a basket containing 7food units and 4 clothing unit (7 + (2)(4) = 15]. However, any one of the two discussed market baskets is preferred over a third market having 4 food units and 4 clothing units. This is because, the utility level of last basket has a 4 + (4) x (2) = 12. The market basket named A can be seen positioned on the highest level of 3 indifference curves (denoted b U3). Its utility level may be 3.But in case of market basket B,it is positioned on indifference curve U2.The utility level may be 2, on the indifference curve U1. The utility level of market basket D is 1. This means, that, both indifference map and utility function solves the same purpose.
u(F,C) = FC denotes the utility function. This indicates that the satisfaction level is the product of C clothing units and F food units. The indifference curves linked with these functions is shown in the figure. The graph was outlined by choosing a specific market basket, like C = 5 and F = 5at a certain point A. This corresponds to utility level U1 = 25. Is outitity curve (also known as indifference curve) was constructed by evaluating every market baskets for which FC = 25 (C = 2.5 and F = 10) at point B, whereas F = 2.5 and C = 10 at point D. U2 (the 2nd indifference curve) contains every market baskets where FC = 50 and U3 (the third indifference curve) contains every market baskets where FC = 100. Observe the market basket that earlier has the utility level 25 (where C = 5 and F = 5), the level now has increased to 100. The indifference curves linked with the utility function FC and 4FC differ by numbers not by 25, 50 and 100 but by 100, 200 and 400.
Utility function, thus, is a way to rank different market baskets. No information can be obtained by the magnitude of two market baskets and their utility difference. This is pretty much true and obvious as there is no way to measure a consumer’s level of satisfaction. The only thing that we know is that the measurement of utility is depicted by indifference curves. But we are unaware how much of one item is preferred over another.
Cardinal versus Ordinal Utility
Figure 3.3 shows three different indifference curves that provide the ranking of market baskets that is ordinal or ordered. This is why the utility function generating a ranking of the market baskets is termed as ordinal utility function. Rankings which are linked with ordinal utility function and which positions market baskets in order of their preference, they start from most preferred to the ones which are least preferred.
But, again, it certainly doesn’t relay us the level with which one item preferred over another is. There is catch in this ordinal utility function. Let’s assume that Bob’s ordinal utility function links to its utility level which is 5 to a textbook, whereas Jane’s utility level linking with utility function is 10. Who will be happier to get the textbook? This is uncertain, as the numerical values are random and hence to carry out this comparison is not possible.
The economists worldwide earlier believed that in terms of basic unit individual preferences is possible to be measured. And therefore, providing a ranking for interpersonal comparisons is possible. This would straight away mean that Jane receives two times as much satisfactory result as Bob. But, the numerical values which are assigned to the market baskets in this manner actually have no meaning, and gives rise to the cardinal ranking.
Cardinal utility is a measurement of the utility function that determines the preference one market basket and by how much is it desired over another. Fortunately, the constraint of linkage of numerical values to consumers’ preferences does not matter much. The important thing that one should know is how a consumer ranks the different market baskets. So, the major work revolves around ordinal utility functions.
3.2 Budget Constraints
Whatever discussion we made so far is on the very principal element of consumer paragon, which are the preferences of buyers. We know by now, how can we use the concept of indifference curves or in other words, utility functions to describe consumer’s preferences for various market baskets. Now, we will study the additional element of consumer paragon, which is the budget constraint that is because of a finite income.
The Budget Line
Let us consider an example, where a person has a limited income, I. He needs to purchase F units of food and C units of clothing. Let the two items have prices that are denoted by PF and PC respectively. So, the money that is spent on these items will be PFF and PCC respectively. The budget line includes all possible combinations of C and F, where the combined amount of spent money is equal to a consumer’s income.
As, we are not considering saving and other expenses here, so we assume that all the earnings of the consumer is spent on both clothing and food. Accordingly, the combination of what he can purchase will be:
PFF + PCC = 1 ….(3.1)
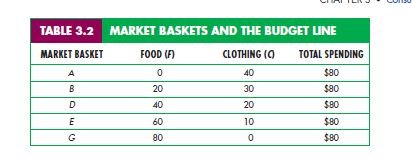
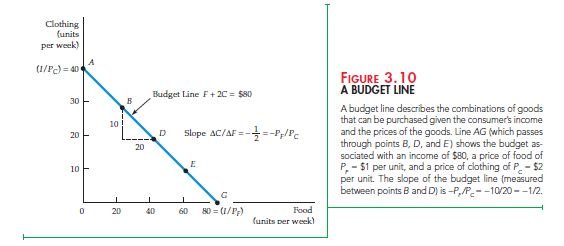
Let us consider the income of the person to be $80 in a week. $1 be the cost of one unit of food and $2 be the cost of one unit of clothing. There is a list of the various combinations of clothing and food that he can purchase every week. Had he spent his entire income on clothing, he could buy 40 units of clothing. This is represented as A (market basket). On the other hand, if the entire budget was spending on food, he could purchase 80 units of food. This is represented as G (another market basket). There are three other ways, by which he can spend his $80. These are indicated by E, D and B respectively.
The budget line linking to market baskets of this table is indicated with the help of a graph. Since, substitution of 1 clothing unit costs $2 and purchasing 1 food unit costs $1, so, the quantity of clothing that is given away for food must remain similar everywhere along the budget line. As its out come, the budget line is straight, beginning from point A and going up to point G.
The equational formula for the budget line in our example is, F + 2C = $80. Basket A indicates the intercept. As the man moves along that particular line from basket A to G, he tends to spend more on food and less on clothing. The food price to that of the clothing ratio ($1/$2 = 1/2) indicates the units of clothing that the man is willing to give away to have an additional food unit. The inclination of the line (ΔC/ ΔF = -½), indicates the relative cost of clothing and food.
Now a certain equation tells us the amount of C given away to have more of F. If we divide the L.H.S and the R.H.S of the equation with the help of PC, we will have:
C = (1/PC ) – (PF /PC)F
The above equation represents a straight line. The vertical intercept is 1/PC , the vertical intercept is 1/PF and the slope is −PF /PC . The magnitude of the inclination indicates the rate where the two items can be switched with each other destituting a change in the total amount of spent money. The vertical intercept signifies the maximum quantity of C which can be bought with income I. The parallel intercept signifies the specific unit numbers of F that can be purchased if the entire income was allowed to spend on it.
The Changing Effects of Prices and Income
Income and price of goods (PC and PF) influence the construction of a budget line. However, there often happens a change in prices and income. Let us see the effect of changes on the construction of the budget line.
Income changes
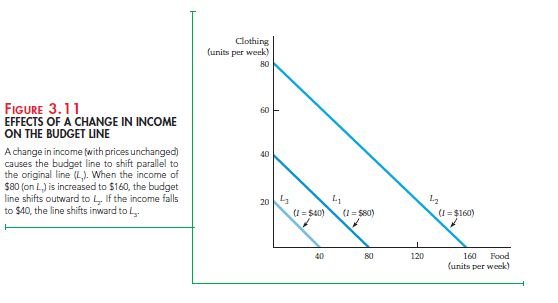
From a certain equation, we can observe that an income change is the reason of vertical interception of the budget line. However, it does not alter the inclination as the cost of either of the two items remains unchanged. If in case, the income is increased twofold (from $80 to $160), there occurs a shift in the budget line from L1 to L2 (both L2 and L1 are parallel to each other). This is shown in figure 3.11. If the consumer that we are talking about desires, he can double his purchase of clothing and food. Similarly, if the income got half of the actual (from $80 to $40), there occurs an in ward shift in the budget line from L1 to L3.
Price changes
Let us understand the situation, when there occurs a change in the cost of one item without a change in the cost of another.
C = (1/PC ) − (PF/PC)F
This equation can be used to analyze the effect of a change in the cost of food on the budget line. Let us consider an example, when the cost of food reduces by half that is from $1 to $0.50. On such cases, the vertical interception of the budget line remains unaltered, whereas the inclination changes from, −PF/PC = -$1/$2 = -$1/2 to -$0.50/$2 = -$1/4. A new budget line is obtained which is denoted by L2and by rotating the actual budget line L1 outward, thus spinning from the C-intercept. This is represented in figure 3.12. The rotation is necessary as a person who consumes only food but not on clothing, food remains unaffected by the change in price of the food items. But, a person who consumes food in a large amount will tend to purchase more by this price decrease of food item. However, when the price of a unit of food increases from $1 to $2, rotation of the budget line is inward to line the L3. So, the ability to purchase sees a decline. Now, in this scenario, the person consuming clothing only, would remain unpretentious by the change in food price.
Now, let us see, what happens when the prices of clothing and food both change. The inclination of the line will remain the same. This is because; the inclination of the budget line is equivalent to the ration of the two values (costs). However, there must be a shift in the intercept, such that the new line remains comparable to the earlier line. Let’s say, the costs of both the items reduce by half. In that case, there is no change in the inclination of the budget line, but there occurs a doubling of the intercept and the budget line shifts outward.
Thus, we can say that acquiring power is resoluted not only by the income of a person, but also with the help of prices of items. Let us now consider a case, where the costs of the items and the customer’s income increase. This state is known as a stage of inflationary economy. Since there occurs a two fold increase in the prices of both the items, so there occurs no change in the ratio of the costing. Consequently, there happens no change in the inclination of the budget line.
Now since the income has also doubled, the maximum clothing units that can now be purchased indicating the vertical interception remaining unaffected. The same holds correct for food. So, the conclusion is, when both income and prices see a proportionate increase, the purchasing power or the budget line remains unchanged.
3.3 Consumer Choice
Consumers have their own preferences. Also, they do have budget constraints. So, with these two conditions, how can a consumer choose the amount of goods to purchase? We believe that there is consumers take this decision in a logical way. They take into account their feeling of satisfaction. The increase the quantity of goods that provide them the maximum satisfaction. This maximization of market baskets should fulfill the following conditions.
- It must lie on budget line – Market baskets that are to the left hand side and beneath the budget line have incomes that are not allocated. These are the incomes which on spending can add on to the consumer’s feeling of satisfaction. In case the consumer wishes to put aside some of his income for future utilization, then, the choice just not stay between clothing and food, but it extends to consuming of clothing and food now or in the near future. Now, at this stage, let us keep the things simple and assume that all the income is expended by now. Be careful about the thing that a market basket lying on the right hand side of and overhead the budget line can’t be bought with the current income. Thus, there is only one logical choice of basket and that lies on the budget line.
- It must be able to deliver the most favored combination of merchandises and services to the consumer
The two conditions are the answer to the issue of maximum consumer satisfaction. In the clothing and food example, that we are considering, we can explicitly indicate the solution to the choice issues of consumer. In a certain figure, there are three different indifference curves that demonstrate a consumer’s inclinations for clothing and food. Among the three different curves, it is the last external curve, U3 that gives the maximum feeling of satisfaction. The curve U2 is the next highest while the curve U1 is the minimal one. Observe carefully, that B on curve U1 is not the preferred choice as reviewing of income and then spending is less on clothing and more on food can upsurge the satisfaction level of the consumer.
When we move towards point A, the purchaser is seen to spend similar monetary amount and achieve an increased satisfaction level that is linked with the indifference curve U2. Baskets that are positioned to the right side and overhead indifference curve U2 (example, the market basket linked with point D on indifference curve U3), though achieves a higher satisfaction level, yet it cannot be bought with the income that is available. Thus, the point A indicates, maximum consumer satisfaction.
Figure 3.13: Maximizing consumer satisfaction
This analysis clearly means that the market basket which increases the satisfaction level, lies on the peak indifference curve that gets connected to the budget line. The point A, indicates tang ency between the budget line and indifference curve U2, and the inclination of the budget line at this point, equals the inclination of the indifference curve. Therefore, MRS = -ΔC/ ΔF. Since, there is a negative sign in the inclination of the indifference curve, the satisfaction attains the maximum level (even though there is a budget constraint) at even the point where,
MRS = PF /PC …(3.3)
This result holds significance. Note here, that Satisfaction attains the maximum level, when F for C (the marginal rate of substitution) gets equivalent to price ratio (of F to C). Therefore, by adjusting the consumption of merchandises, C and F, and keeping the MRS same to the ratio of the prices, a consumer can obtain the maximum satisfaction.
The condition is stated in a graph which suggests the various kinds of economic optimizations. Satisfaction attains the maximum level once the marginal benefit (benefit that is linked to the utilization of one additional food unit) equals the marginal cost (price of an additional food unit). MRS which is an indication of marginal benefit, at the point A is ½ (it is the same as that of the inclination of the indifference curve). It indicates that the purchaser is willing to part with ½ of his or her clothing units to obtain an additional food unit. The marginal cost, at similar point is calculated by magnitude of inclination of budget line, which is also equal to ½. This is due to the cost involved in consuming one food unit is equivalent to the cost involved in giving up ½ clothing units (PC = 2 and PF = 1 on the budget line).
The consumer’s level of satisfaction is not said to attain the maximum level, when the MRS is greater or lesser than the price ratio. For example, point B indicates that the consumer is buying30 clothing units and 20 food units. The marginal price or the cost ratio comes out to be ½ as food expenses are $1 and clothing costs $2. But, the marginal benefit or the MRS is larger than ½ and approximately equal to 1. As an outcome of this, without any loss in the satisfaction level, the purchaser is able to exchange 1 food unit for 1 clothing unit. Considering the fact that clothing is expensive than food, it is entirely the consumer’s choice to purchase less clothing and more food. If however, he chooses to purchase one less clothing unit, the $2 set aside can be allocated to 2 food units. He will still continue to maintain his satisfaction level, as only one clothing unit is required for that.
The review of the budget carries on to happen in this manner, where continuous movement throughout the budget line till point A, gives the price ratio to be ½. This indicates that our consumer is willing to exchange one clothing unit for two food units. He however has the maximum satisfaction, when MRS = ½ = PF/PC.
This MRS result is illusive only. Consider a case, when two consumers have just bought certain quantities of clothing and food. If both of the mget maximized, then we can find out that, the price of each of the individual’s MRS by considering the values of both the goods. However, we cannot find out the amount of each of the goods. This decision is arrived by measuring individual preferences. Even if MRS is same for two consumers, they will tend to consume different clothing and food quantities.
Example 3.3 : Designing New Automobiles (II)
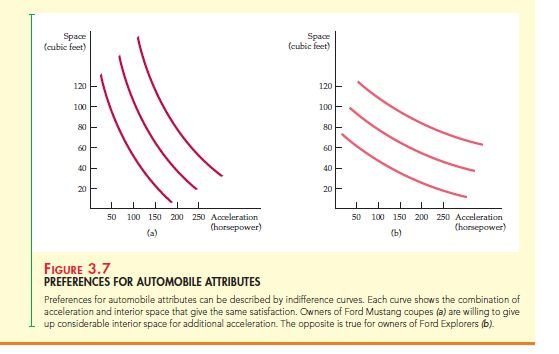
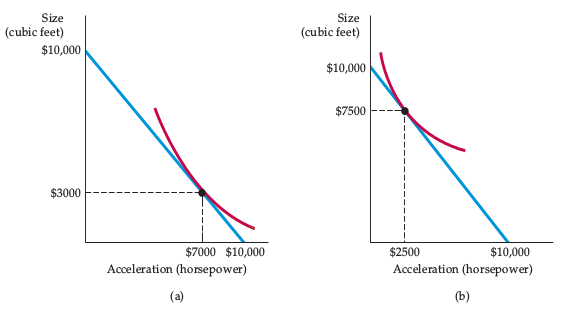
The knowledge we have till now lets us to analyze consumer’s choices and understand different consumer preferences for automobiles. This can influence their buying decisions. In relation to example 3.1, you can now consider two consumers’ groups who are making plans to buy brand new cars. Now, since each purchaser has a budget of around $20,000, but decided to keep $10,000 for the interior size and $10,000 as an approximate for acceleration. Each of the groups has different inclinations for acceleration and size. Figure 3.14, represents the budget constraint that is faced by people in each group. Figure 3.7 has the leading group representing consumers who prefer acceleration over size. By tracing out the point of tan gency between the budget constraint and an individual’s typical indifference curve, we can find out that the consumers residing in this specific group would prefer a car having acceleration worth $7000 and size worth $3000. People in the 2nd group, prefer cars whose worth of acceleration is $2500 and worth of size is $7500. An automobile company will utilize statistical studies and marketing to learn the broad set of attributes of different consumer groups. The firm can come up with a marketing and production plan by combining the information of all the features that affect the manufacturing costs. One profitable option could be to market by highlighting acceleration to a somewhat lesser degree that is favored by those in figure. The second option could be to manufacture larger car numbers, emphasizing a smaller number acceleration and size. To have knowledge of predilections of each group, along with info about the buyers, would help the company to make a better and sensible business decision. A similar kind of survey was prosecuted by the General Motors on a large number of vehicle purchasers. The result they obtained was functionality was preferred over style by households with that of children. So, they preferred minivans over sporty and cars sedans.In a different case, rural households preferred pickups and wheel drives. An interesting relationship was found between preferences and age. Consumers, who were older, prefer heavier and larger cars with additional accessories and safety features. Younger consumers however preferred stylish cars with more horsepower.
Figure 3.14 : Consumer’s choice of automobile features
Figure (a) shows, having a budget constraint, consumers willing to substitute some extra amount of interior space for some amount of acceleration. Figure (b) represents the opposite of this.
Corner Solutions
Often consumers are seen to purchase goods in excess. There are some people, who prefer not to spend a penny on entertainment and travel. The circumstances under which buyers choose not to use a particular group can be represented using indifference curves.
Figure 3.15, shows the behavior of a man on budget line AB for eatables like snacks. He prefers to buying only ice candies (IC) and not frozen yogurt (Y). Decision like this is said to be a corner solution. The consumption bundle gets formed at the graph corner, when one of the eatables is not consumed. The point B indicates the maximum satisfaction, where the MRS of ice candy is more than the incline of budget line. The inequality indicates that if the purchaser had more yogurts to trade off, he would gladly do it for an additional ice candy. It is not possible to have negative amounts of yogurt, as the consumer is consuming only ice candy and no yogurt.
When there is a situation of corner solution, the consumer’s MRS needs not to be equal to the price ratio. In this case, the corner solution to attain maximum satisfaction by making a choice between ice candy and yogurt is indicated by the given inequality.
MRS ≥ PIC/PY …(3.4)
Figure 3.15 : Corner solution
A corner solution rises, when the consumer’s marginal rate of substitution is not equal to the price ration for all the levels of consumption. On the budget line AB, satisfaction attains the highest level at point B on the indifference curve U1. MRS in this case is of the ice candy for frozen yogurt and is more than the ratio of the price of ice candy to that of the frozen yogurt.
There occurs an inequality reversal, when the corner solution is at point A. The equality of marginal benefit with marginal cost holds true, when the consumer consumes positive quantities of all goods.
In order to predict the quantity of goods that buyers will purchase when they face the changing economic conditions which depend highly on the nature of consumers’ preferences for a particular product and the related products. It is also dependent on the incline of consumer’s budget line. Figure 3.15, shows that MRS of ice candy is much higher than the price rationed. Hence, there occurs a decline in the cost of frozen yogurt. He will still prefer ice candy over frozen yogurt. However, if there occurs a substantial decline in the cost of frozen yogurt, then the consumer could spontaneously respond by consuming large quantities of the same.
Example 3.4 : Consumer choice of health care
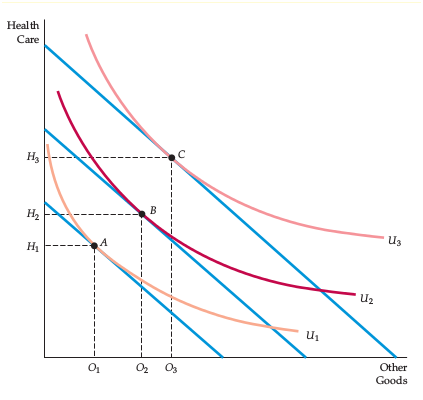
Health care expenses in the United States have risen drastically over the past few decades. This alarming situation. Economists worldwide, have a reason for this that is hard to believe. They say that these expenses have increased as the overall healthcare system is quite inefficient. But, there could be another reason for this. We may believe that, as the consumers get economically better, the preferences tend to shift away from other goods and toward health care. Think of this situation by considering yourself to be an owner of a bungalow and two cars. You would definitely go for an additional medical care that might increase your longevity, and your preference for another car takes a back seat.
Figure 3.16 indicates the preference for health care. A series of indifference curves and budget lines can be observed here. This shows the trade-off between health care (H) versus consumption of other goods (O). The indifference curve, U1 indicates a consumer having low income. The budget line of such a consumer is tangential at point A. In this manner, the consumption of health care and consumption of other goods that maximize the consumer’s satisfaction are H1 and O1. Greater satisfaction level is attained by the indifference curve U2. However, this is possible only when the consumer has a higher income. The utility is said to be the maximum at point B. Curve U3 indicates the behavior of a consumer having high income but less willing to give up health care for other goods. A considerable increase in expense on health care is observed when we move from point B to point C (from H2 to H3). The consumption of other goods however increases very slowly, from O2 to O3. This has been observed that if your income is high enough that you can afford the most luxurious things, you would first of all go for a life-extending health care.
Figure 3.16 : Consumer preferences for health care versus other goods
Example 3.5 : A college trust fund
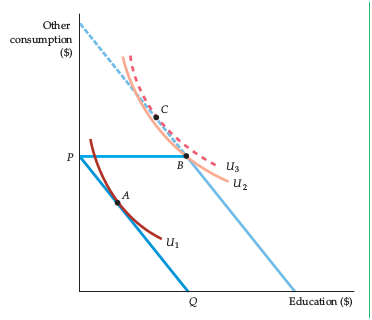
There is an 18 year old student named Marie, whose parents have started a trust fund regarding her college education. Of course, Marie can receive the complete fund but the condition is that she spend it only on education. Though it is a gift, yet it is a type of restricted trust. At least, this is what Marie feels. Observe figure 3.17 carefully, to understand why Marie thinks so. The horizontal axis represents the dollars spent on education per year. The vertical axis represents the dollars spent (generalized aspect) on other forms of consumption. Marie faces the budget line PQ before being awarded the trust. The trust fund leads the budget line to expand in the outer zone as long as the complete amount of the fund. This is shown by distance PB what is spent on education. Now going to college and accepting the trust fund, Marie increases her satisfaction level from A, which is highlighted on indifference curve U1 to B, highlighted on indifference curve U2. The corner solution is represented by point B. This is Marie’s marginal rate of substitution of education for consuming other goods, which in fact, is less than the relative cost of other goods. Marie would also like to devote a certain amount of the trust amount on other goods along with education. Without any constraint on trust fund, what she can also do is move to C. it is on indifference curve U3. She might also opt to reduce some of her expenditure on education for using it on items that she gives equal importance to. The recipients mostly prefer to have unrestricted trust. Restricted trusts are prevalent among parents as they could keep a check on their children’s expenditures. This is the way, they have faith in favor of their children’s good future.
3.4 Revealed Preference
We have learnt to represent a series of indifference curves by individual. Further, we learnt how preferences can determine choices when there is a budget constraint. Now, can we reverse the process and if we have the knowledge of the choices of a consumer, can we determine the preferences that he or she has? Yes, we can do so, if we have the knowledge of enough choice numbers that was made when the prices of items and the level of income were wide-ranging. The basic idea is that if a purchaser chooses to have one market basket over another, he will remain with his chosen basket only, even if it is more expensive.
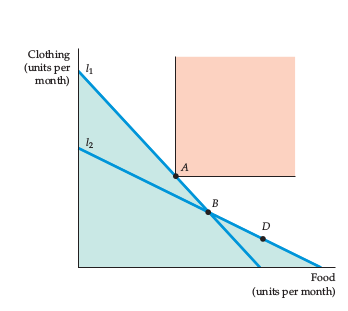
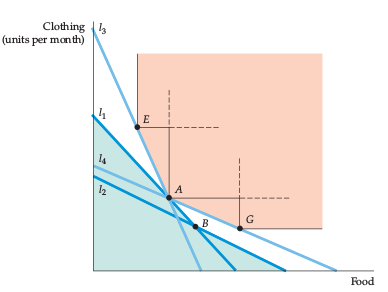
Suppose a consumer faces the budget restraint given by the line l1, and chooses the market basket A. Now, let us carry out a comparison of market basket A to market basket B and D. Since, the consumer could have purchased the market basket B, and all the baskets that are below l1, we can state, A is preferred over B. Initially it may look like that a direct assessment between basket A and D cannot be made, since D does not lie on l1. If in case, there is a change in the relative price of clothingand food, its new budget line becomes l2, and the consumer chooses the market basket B. Since, D is on budget line l2 and wasn’t selected; B is favored over D and all market baskets that is below the line l2. A is preferred over B and this second point is preferred over D. Hence, we can arrive at the conclusion that A is favored over D. An important thing to note here is that the market basket A is favored over all baskets that come in green-shaded areas. Since, clothing and food are considered as ‘goods’ and not ‘bads’, so all the market baskets lying in pink-shaded area. And the right side of A is favored over A. So, the indifference curve that passes through A should lie in unshaded area. If we have knowledge of choices, where the prices and income levels vary, we can get even a better indifference curve.
Figure 3.18: Revealed preference – two budget lines
Figure 3.19 shows that the consumer facing the line l3, and the budget line passing through the point A, chooses the market basket E. E was preferred even if A was expensive equally and lies on same budget line. Let’s assume that the consumer now faces the line l4 that passes through A and chooses the market basket G. Since G was chosen, it clearly indicates that G is preferred over A, as all the market baskets overhead and to right of G. By now, we know indifference curves are convex. Since, E is preferred over A, all the market baskets lying above and to the right of line AE, must be preferred over A. Thus, the indifference curve that passes through A that requires going through a point overhead and to right of AE. Then, it must fall beneath the line E. Accordingly, all points above or on AG are favored to A. Consequently, the indifference curve must lie inside the unshaded area. This example show, revealed preference analysis that can help to understand all the implications of choices that consumer make in certain circumstances.
Figure 3.19: Revealed preference – Four budget lines
Consumer Choice and Marginal Utility
We have learnt to represent the ways of maximizing consumer satisfaction keeping in mind the budget constraint. This is done by discovering the maximum indifference curve. The curve that has the highest indifference has also the highest attainable utility level. We can redefine our findings by initiating an exercise of comparing total utility attained by satisfaction and consumption achieved by consuming the last item. Marginal utility (MU) is a measure of additional satisfaction achieved by consuming an additional unit of an item. An example could be considering the marginal utility that is associated when there is an increase in consumption from 0 or 1 food unit to 9 food units, or, from 1 or 2, it might be 7; or, from 2 or 3. It can also be 5.
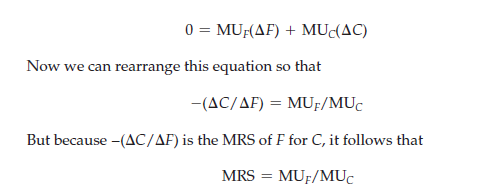
This indicates that the purchaser has a decreasing marginal utility. Consumption of additional amount of an item will result in lesser and lesser additions to utility, as greater an item is consumed. An example of this could be the fall in marginal utility of television after the 2nd or the third hour. It could further lessen after watching it for four or five hours. Let us now consider a little movement down the indifference curve. A marginal utility of MUF will be generated, by the consumption of an additional unit of food, ΔF. This results in a over all hike in utility of MUFΔF. Simultaneously, the condensed consumption of clothes ΔC, leads to a less utility per unit MUC. This leads to a complete loss of MUCΔC. Since, the similar level of utility is generated by all points on indifference curve; total increase in utility with increase in F should balance the loss because to lower purchase of C.
The above equation indicates that MRS is marginal utility ratio of F to marginal utility ratio of C. Being a consumer, substitutes more of C is more of F, which is the reason for marginal utility of C to rise, whereas that of F falls. Consequently, MRS also decreases.
We noticed earlier that when consumers attain maximum satisfaction, then,
MRS=Pf/Pc …(3.6)
From equations (3.5) and (3.6),
MUf/MUc = Pf/Pc
MUf/Pf=MUc/Pc …(3.7)
The above equation is very important. It indicates that maximization of utility is achieved when there is an allocation of budget and the marginal utility per dollar of spending is similar for each item. Let us validate this, by assuming that a person receives more utility by disbursement of additional money on food than on clothes. The utility in such a scenario will see a rise by paying more for food.
A consumer can increase his or her level of utility by shifting the budget towards food as long as marginal utility of expenditure of an extra dollar on food surpasses the marginal utility of expenditure on an extra amount on clothes. So, a decrease in the marginal utility of food and an increase in the marginal utility of clothing will be observed. When the equal marginal principle of the consumer is satisfied, he or she will have enjoyed the maximum utility. The principle of equip-marginality is an essential concept in microeconomics and will appear in diverse forms throughout our study of purchaser and producer behavior.
3.6 Cost-of-Living Indexes
There had been times when questions were asked, and debates took place regarding the security system prevailing in the society. As per this system in this present scenario, a person who has recently retired will be getting a yearly benefit that is determined according to their work history.
As per this benefit, the level will increase every year at a certain rate that is equivalent to the amount of upsurge of CPI (Consumer Price index). But there are certain queries too in this respect. Few of them include:
- Is the utilization of CPI fit to be utilized by government programs, private wage agreements, and for private union pensions as cost-of-living index?
- Does cost of living for the retired people correctly reflected by Consumer Price index?
- Considering the cost involved in production, does PPI (Producer Price Index) make precise measurement regarding the change in the process?
For all these questions, the solution lies in economic theory of customer performance. With the help of elucidated explanations regarding cost indexed and its theoretical underpinnings, its answers are highlighted.
Ideal Cost-of-Living Index
Suppose there are 2 brothers, Jeremy and Stefan whose style of living and preferences are near about same. At the beginning of Jeremy’s academic life in college, his parents had set a discretionary budget of a certain amount (assume $1000) on a half yearly basis. That amount will involve money on books, food and other necessities. So price of books were $20 each whereas on food, the price was fixed at $2 per pound. He bought 15 books and 100 pond food.
After 10 years, the younger brother, Stefan,gets admitted to the same college. Although equivalent amount was promised but as prices of commodities increased with time, the amount structure also got changed for the younger son. In his case, the price for per book increased to be $100 and $2.20 per pound.
What should be the new discretionary budget that should be fixed keeping the aspect of identical preferences?
Solution
The solution has to be made on quarterly basis.
As per the budget sufficiency of Jeremy in quarterly basis,
$1000 / 2 = $500
Therefore, for Jeremy,
$500 = $2.00 per poundx 100 pound of food + $2 per book x 15 books
As there had been a hike in prices (on the basis of amount change per year), the level of utility that is required by Stefan to reach the same level as that of Jeremy is,
$1260 = $2.20 per pound x 300 pound of food + $100 per book x6 books
The adjustment to find the ideal cost-of-living for Stefan will be,
$1260 – $500 = $760.
So, the cost of living index is,
$1260 / $500 = 2.52
Laspeyres Index
In order to find the perfect cost of living index, one has to go through much information to get the final result. This is an adverse side of this index. But the actual requirement for us is to know expenditure and prices and also individual preferences. But actual price indexes are not based on preferences but on consumer purchases. So, when a price index which on its base period uses fixed consumption bundle, it is known as Laspeyres price index. Laspeyres price index is denoted by LI.
Paasche Index
Paasche index is one of the other commonly utilized cost of living indexes. The working procedure of this index is not same as Laspeyres index. Where Laspeyres index mainly emphases on the worth of bundle on base year basis; Paasche index emphases on cost of bundle in the present year.
This index can also be stated as the quantity of capital that a person requires at present year prices for purchasing a package of services and goods. The method of calculation is based on the equation formed by,
Chosen present year / purchasing cost of the similar package in base year
Paasche index is denoted by PI and is considered as a fixed-weight index.
Price Indexes in the United States: Chain Weighting
It is from U.S. Bureau of Labor Statistics that an overall CPI is computed and it is performed on a monthly basis. If only the measurement is taken into account regarding Laspeyres price index, PPI and CPI are both calculated by this index.
- PPI is calculated with the help of bundles of wholesale and intermediate goods.
CPI is calculated with the assistance of bundle of services and commodities from the same category. Example: housing.
Links of Previous Main Topic:-
Links of Next Microeconomics Topics:-
- Consumer Behavior
- Appendix to Chapter 4 Demand Theory a Mathematical Treatment
- Uncertainty and Consumer Behavior
- Production
- The Cost of Production
- Production and Cost Theory A Mathematical Treatment
- Cost in the Long Run
- The Cost of Production Production with Two Outputs
- Profit Maximization and Competitive Supply
- The Analysis of Competitive Markets
- Market Power Monopoly and Monopsony
- Monopolistic Competition and Oligopoly
- Game Theory and Competitive Strategy


