Cost of production of a firm depends on prices of factor inputs and the production technology of the firm. When a firm’s production technology is known to the producer of the firm then he must decide how to produce and how much to produce. In order to gain the same amount of output combination of inputs can be used in different ratios.
For instance, one can produce a certain amount of output using a combination of lots of capital and least number of labor or by using lots of labor and least capital or by using some other combination of these two factors of production.
Here our focus will be on the fact that how the optimal i.e. the cost-minimizing combination of inputs is chosen to enhance the profit of the firm. We will also try to understand that how a firm’s cost of production depend on its rate of output and analyze how these costs are likely to change over time. There are two separate ways of accounting for the firm. One is economic, where people are concerned about the firm’s future performance, and another one is from the perspective of the accountants. These people focus on the firm’s financial statements. Distinguishing between the concept used by economists, and by accountants, we will move forward to examine how the firm’s production technology affects the cost of production both in the short run and long run.
The short run is the time when the firm can do a very little change to its capital stock, and the long run is the time frame when the firm can change all of its factor inputs. From here we will move on to check how the concept of returns to scale can be generalized to allow both changes in the mix of inputs and the production of many different outputs. Learning by doing is an important parameter that can affect a firm’s production cost.
Thus, after generalizing the concept of returns to scale we will try to understand how the cost of production sometimes falls over the time as the managers and workers learn from their experience. This not only makes the production processes more efficient but also reduces the price of the final good. Lastly, there will be a section, where the methods of using empirical information to estimate cost functions and predict future costs will be discussed.
7.5 Production with Two Outputs—Economies of Scope
There are many companies who deal with the production of more than a single product. Sometimes various products in a company have close association with each another. For instance, a chicken farm and the poultry produce eggs. Another one is the automobile company, where they produce automobiles and trucks. A university can also be an example because it produces teaching as well as research. Other times, these firms produce products which are physically unrelated and possess different values. If clearly considered in both cases, one company will probably enjoy cost advantages. This happens on the production of two or more items. These benefits can be because of the joint which utilizes production or inputs facilities. Or the other instance may also be due to the advantage of common administration which helps in cost saving. There may be a scenario that the company has to no other way to stop the production of byproduct which is yield during the manufacturing process of one product. This procedure takes place automatically. But both of these are valuable to the company. For instance, during the production of scrap metal, apart from sheet metal shavings are also produced. Both of these are valuable and are easily sold. Thus there is a scope of enhancing profit by producing two outputs by using same inputs or production facilities and by utilizing the administration cost effectively. Now let us move forward to study the advantage of joint production.
Product Transformation Curves
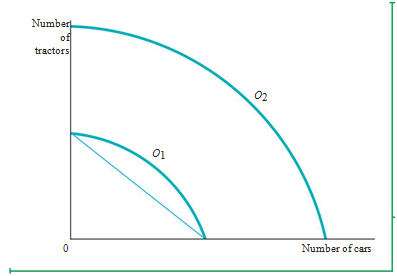
In order to understand the economic advantages related to joint production, production curve is used. Let us take the example of an automobile company which produces 2items. One item involves tractors and the other cars.
Basically, this company has only two inputs.
- Labor
- Capital (machinery and factories)
Although production of tractors and cars do not take place at the same plant, but their management resources are shared. Their combined operations are completely dependent on,
Same machinery
Skilled labor
Factories of the producer
Now managers of these companies need to choose the optimal quantity of each product to enhance the profit of the firm and to get most out of the joint production facility.
From the above Figure, we can see two-product transformation curves. The horizontal axis represents the number of cars and the vertical axis represents the number of tractors. Each of the product transformation curves showing the different combinations of output can be produced using a given amount of input of labor and capital. Curve O1 involves all possible arrangements that can be processed because of the two different end results. Also, this takes place because of comparatively low input level. And in case of the other curve, i.e., O2, it defines the end results only in case when the initial stage is half the time of inputs. Now, the most important question is the presence of a negative slope that can be seen in product transformation curve.
If a company wants to gain more than a single end result, the basic thing they need to do is renounce some of their other end results. For instance, if a company’s emphasis is on vehicle production like sports car, then the resources for the production of tractors will be less than the former one. In the graph highlighted above, the position of curve O2 is farther from curve O1. This distance is nearly twice if calculated with each other. The positioning of these curves represents that the production procedure of this company is a constant process highlighted by CRS or also called constant returns to scale. Its focus is in both items’ production.
Economies and Diseconomies of Scope
Economies of scope are the situation that specifies to joint output which is higher than the output of two different firms if each of these firms produces a single type of product. On the other hand, consider joint output of one firm is lesser than what the firm can produce separately. If each of these firms produces a single type of product is known as the diseconomies of scope. Possibility can take place if there is a high contrast between the manufacturing of one item with the manufacturing of the second item.
One must remember that no direct connection of economies of scope and the economies of scale can be found out. There may be a certain instance when a company producing two-outputs can get benefitted from the economies of scope. This situation can even arise even if diseconomies of scale are involved in its manufacturing process.
To state in a simpler way, piccolos and flutes production is way cheaper if it is done together. But on manufacturing separately, the costing will be higher. Apart from this, the costing also involves highly skilled labor even of the company runs on a small scale. Now, assume that a large corporation will be able to produce efficiently if it has many of its smaller firms. Because of bring administered properly and separately, it provides more benefit.
The Degree of Economies of Scope
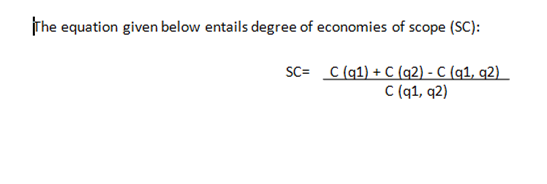
It is the percentage of cost savings when the products are two or more than two produced simultaneously. By studying a firm’s costs the extent of the economies of scope, this value can easily be determined. If any firm uses the combination of inputs to generate more output, then it costs will be less for single firm that it can produce both the products.
When physical units of different outputs added, then the above expression will become C (q1 + q2). It measures the cost of joint production. From here, we can clearly see, with the value of economies of scope, value of joint cost will be less than sum of individual costs. Moreover, SC will be more than zero, which supports the fact that cost savings when one or more products can be produced together rather than one by one, it will be greater than zero if economies of scope persist. On the other hand the percentage change with diseconomies of scope, the value of SC is not positive. In general, it has been observed that larger value of SC will give the greater economies of scope.
Dynamic Changes in Costs— the Learning Curve
The reason for large firm has lower long-run average cost while small firm will have higher, it has been acknowledged from the discussion prior to this section. However, let us remind you again. The main reason behind this happening is increasing of the returns to scale related to production. The exciting to state that each of these firms relish its lower average cost are the growing firms, which has increasing returns to scale. However, in some firms, the long run of average cost tend to decline over the time because new technological information is readily available to the managers and workers when they become experienced. As the management team and labors practice to gain some experience, the firm’s average costs and the marginal cost of producing starts to fall. These falls mainly have four reasons which are as follows:
- Workers are human beings. They learn by doing. As they become familiar to the subject with experience, their speed automatically increases.
- Starting from the flow of these materials to firm of its manufacturing itself, Managers learn how to schedule production process better. Similar will be for engineers and suppliers in their respective jobs.
As a consequence of these aspects, a firm learns over time as the cumulative output day by day increases. This learning curve is the graph needed by a firm to know how workers are ready to produce each unit to get cumulative output. Let’s us move on to know the graphical representation of learning curve.
Graphing the Learning Curve
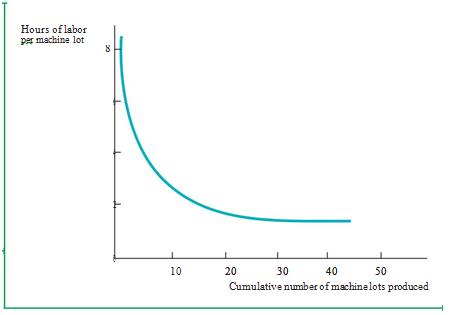
As you know a firm’s production cost is likely to fall, the managers and workers will become experience and more effective how to utilize the plant and its available equipment. Learning curve depicts to which extent any firm requires labor hours for per unit of output when the value of the cumulative output increases. With the help of this learning curve, proper machine tool production can be showcased. It is in the horizontal axis where the collective machine tool is measured. This graph is made by the company to see their production ratio. The vertical axis depicts the number of labor hour required for the production of every single lot. Here, the labor input of the output (per unit) produced directly related to the production cost. The fewer hours of labor should be needed so that lower marginal and average cost of production and higher amount of labor hour leads to higher marginal and average cost. Below figure shows the learning curve-
In this case, collective units of output are denoted by N which is manufactured in the company, and labor input per unit is denoted by L which depends on the output. b, B, A; all three of these are constants. The positioning of b is between 0 and 1 when B and A are positive. The value of (A + B) is equal to L. This valuation is valid in a specific case when the value of N is equal to 1.In order to produce individual output unit, the requirement of this labor input take place. This measurement is done with the help of (A + B).
The value of collective level will rise on the grounds of similar value of labor input of output (per unit) with the former one. This is possible when b = 0.
When the value of b is positive and the value of N gets larger, then L tends towards A. Hence, it can be said that minimalized labor input of output (per unit), which is highlighted with A, takes its appropriate position after its complete learning. If the learning effect is more prominent than b’s value will be higher than A..
Learning versus Economies of Scale
Now the question is which is important? Learning by doing or gaining economies of scale! Well, let’s discuss this. Learning curve is decisive that the firm wants to predict cost of producing a new product. Once the firm produces enough good to make their profit ever increasing, we can easily utilize the usual cost analysis with the help of learning curve. After the completion of its full effect, this analysis can be made. Now in case, if there is a comparatively new production procedure, the effects would be seen in 2 scenarios.
- At higher level, moderately low cost
- At low output level, moderately high cost
This would indicate not the scale of economies but the learning effects.
The cost of production for a company with expertise is comparatively low if the finding is based on learning. This finding is based on the fact, irrespective of the operation or functionality scale that a company uses as per the scale. If machine tools are produces in lots in a certain company, it states that this particular organization benefits from economies of scale. In order to get the at added advantage, machines are produce in large quantity. When linked to size, this step also helps to lower the total cost. Regardless of there is a, a company can easily reduce its cost if learning curve is utilized by them. In spite of individual lot size, manufacturing process can be scheduled with its help.
7.7 Estimating and Predicting Cost
Predicting cost for a business and its operation whether increases or decrease is very important aspect. This helps the firm to decide optimum output level along with the cost of production. Estimates of future costs are obtained with the help of cost function. It relates cost of production to the value of output and its other variables that can be controlled by firm.
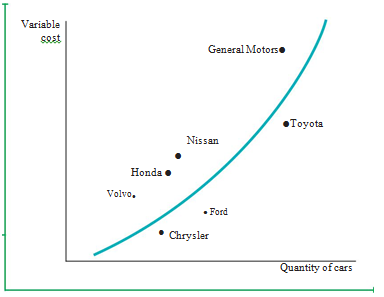
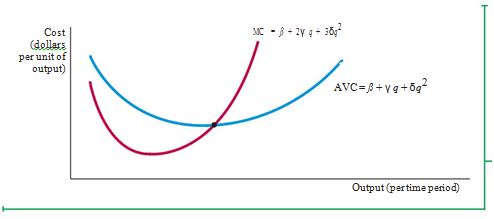
Now we will be focusing on short-run cost of production. We will take the instance of automobile company. As per the graph, we will be utilizing regression analysis for acquiring details like the specific number of cars that are manufactured by every car company provided in the graph. This data is denoted with Q. Using and combining this specific information, a firm can calculate the variable cost of production.
The next question that usually arises in such scenario is why total cost is not considered and utilized instead of variable cost of production. An appropriate answer to this is the approach by viable cost. Viable cost helps in evading the issues which arises during the distribution of fixed cost. This cannot be achieved with utilization of total cost. The above drawn graph highlights output data and cost data.
Cost functions can be difficult to measure, the reasons are as follows
- In case of manufacturing products, if the item quantity is more than one in comparison to its distribution and maintenance, it becomes difficult to produce essentialities of a particular item.
- From accounting information, cost data can be directly acquired. Even if that info is unable to reflect sunk cost and opportunity costs.
- Output data is usually denoted with an aggregate of different product types.
Cost Functions and the Measurement of Scale Economies
In case of a positive economy, when the measurement showcases greater side of the scale of scale (which is greater than one),the value of cost-output elasticity comes to be less than one. This states the presence of diseconomies of scale. Cost-output elasticity is denoted by EC.
The presence or absence of scale economies is described with the help of a certain index known as the scale economies index (SCI).
In equational format, it is-
In this case, there is a visible decline in the cost of production which leads to economies of scale.
Links of Previous Main Topic:-
- Introduction Markets and Prices Preliminaries
- The Basics of Supply And Demand
- Consumer Behavior
- Appendix to Chapter 4 Demand Theory a Mathematical Treatment
- Uncertainty and Consumer Behavior
- Production
- The Cost of Production
- Production and Cost Theory A Mathematical Treatment
- Cost in the Long Run
Links of Next Microeconomics Topics:-


