The Analysis of Competitive Markets
9.1 Evaluating the Gains and Losses from Government Policies – Consumer and Producer Surplus:
In chapter 2, the ceiling price that has been the main reason behind a sudden rise in demand of goods is explained properly. This is an act of Government policies concerning gain and loss. In this case, since the price is lower than normal situations, consumers want those goods more at that time. But at the same time, producers might not be interested to sell those goods at such a low price which is the cause of a fall in supplies. This directly leads to an excess demand which is not fulfilled.
This is when the actual purpose of that policy comes in front. Some of the consumers will still be able to get those goods and at the low price as decided by the Government. In this context some questions come in front:
- If we concern those consumers who fail to consume those goods at a low price then what position is bestowed to the buyers as a whole?
- Should the worse ones get no benefits?
- If we combine both buyers and producers together then what will be the total picture out of it?
- Will the total welfare be higher or lower than it was before? How much will be the difference?
These questions will take you right in front to the matter of measuring profits and losses by Government interference and how does that manipulate market price.
Here in this chapter we will apply specific method to understand the buyer and producer surplus that comes out as a result of government interference. We will learn how to practically approach purchaser and producer surplus.
Review of Consumer and Producer Surplus:
Consumers and producers are involved in buying and selling goods in any type of competitive market at the rate that was already decided. Here you must make a note that some of those consumers are willing to pay higher than what they are now for obtaining that goods. This is where the gap between what they are paying and what they can pay is generating consumer surplus. It is the value of total advantage any consumer enjoys when they buy goods from competitive market.
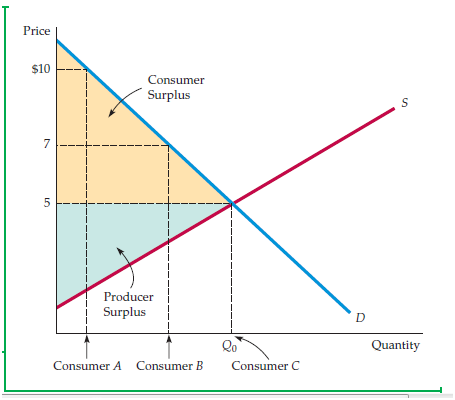
Let us consider the following example and the diagram for it:
Suppose for instance, the market rate is $5 and consumers and producers are willing to buy and sell goods at that price. But consumer named A is actually willing to pay up to $10 for obtaining that goods whereas enjoying a consumer surplus of $5 and getting that exact goods in a low price. Then there is consumer named B who is rather ready to pay up to $7 for obtaining those goods and enjoys a consumer surplus of $2.
Consumer C is not particularly willing or unwilling to get those goods so he is paying exactly $5 and ultimately getting zero consumer surpluses.
Consumer and producer surplus in the diagram and explained:
In the diagram above, that area colored in yellow is showing consumer surplus which will be found in between demand curve and market price. You can actually measure gains and losses of consumers by Government interference with consumer surplus which stands for net benefits of the consumers.
Producer surplus is indicated by a green shaded area in the diagram above. There is a connection between producer surplus and the producers as a whole. In a competitive market, some producers are manufacturing goods at a price which is equal to market rates. Even if some of the producers are manufacturing goods at a lower cost than in market price it will still be sold. The net benefit is still there for any of those producers. Producer surplus is the gap between market price and marginal cost of each unit manufactured.
In the diagram, producer surplus is situated above supply curve and ends to the market price. By net benefit received by producers, we simply mean the benefits earned by producers manufacturing goods at a low cost and selling them in rather higher market rates. We can calculate gains and losses of producers by Government interference with producer surplus and the change in between it.
Applying Producer and Consumer Surplus:
The effects of government interference in the market price will eventually lead to the measurement of gains and losses of consumers and producers. Consumer and producer surpluses are required in this matter. Through that calculation you will find who has gained and who has lost their benefits and by what amount?
We will now comeprice control aspect which was also in chapter 2. The diagram below will have an addition of consumer and producer surpluses on it. The changes in these two surpluses will be affected by Government price policy which made it strictly forbidden for producers to charge higher price rate than ceiling price which is again lower in level from market clearance.
We have already encountered a situation of excess demand as a result of ceiling price which is caused by a decrease in production and increase in quantity of goods demanded. Now we will approach the change in the consumer and producer surpluses step by step:
Change found in consumer surplus:
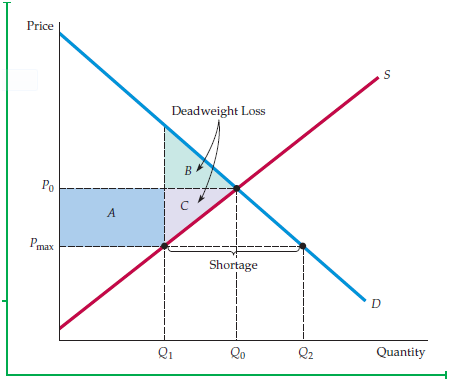
In a competitive market some consumers are identified as better off and some consumers are identified as worse off candidates. The government price policy is the reason behind these two types of consumers. The better off consumers will still buy the goods due to a decrease in sales and production (Q0 to Q1). They can actually get benefits since they can buy their goods at a lower rate.
Then there is worse off candidates who leave the opportunity of receiving net benefits or consumer surplus. When we will come to a fact on how much beneficial and disadvantageous this matter is to better off and worse off consumers, the diagram above is useful.
- The increase in consumer surplus will be identified with blue rectangle A in the diagram.
- This rectangle A will notify decrease in price and number of units that consumers can purchase.
- Then there is triangle B by which the loss of those consumers who doesn’t buy the goods anymore is shown.
- By triangle B we will notice a drop in rate what was needed to be paid by consumers and lost due to a change in output from Q0 to Q1.
- The change of consumer surplus will be A – B. In the diagram ‘A’ holds larger place than ‘B’ so the result is positive.
Price control becomes incapable of providing its actual result in some exceptional cases. We have assumed in the example above that those who want the goods most will buy them. But if that is not the case and Q1 is portioned randomly then the area of lost consumer surplus will be larger than current area of B.
Then there is a need of addition of opportunity cost in lost consumer surplus. Consumers might need to wait for their turn to get those goods which takes time. That time is valuable and needs consideration.
Change found in producer surplus:
Price control is somewhat disadvantageous for producers. Some of the producers will exit market due to the drop of market price. Then again some of those producers will remain due to their lower production cost of quantity Q1. But still they will receive low price for goods and losing producer surplus found in rectangle A.
The consumers will need goods but because of lack of producers available in the market a drop in production will occur. The loss of producer surplus of both types of producers is shown by triangle C. The change of producer surplus will be – A – C.
What is deadweight Loss?
Often it is mistaken that loss of producer’s surplus is compensated by gain of consumer’s surplus by price control. But that is not true. You will find a net loss in the total of buyer and producer surpluses.
Net loss of consumer surplus:
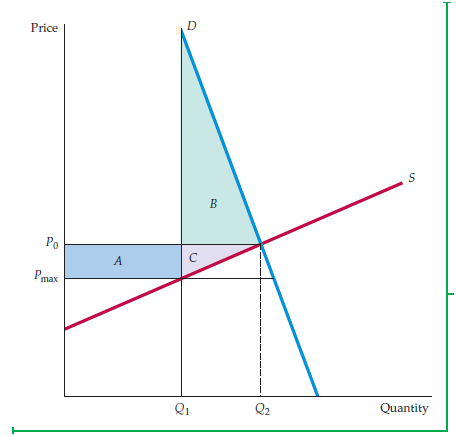
Price control bears no actual political weight when politicians start to give importance to consumer surplus rather than producer surplus. If demand curve remains stiff for some reason then price control will be the reason behind net loss of consumer surplus. Consider the diagram below:
Here:
- Triangle B stands for loss of consumers who left market.
- Rectangle A stands for gain of consumers who bought the goods.
- In that diagram, you are going to find B is larger than A.
- This situation occurred due to the highly demanding goods and consumers who failed to get them. So the result is a large loss at the end of the consumer surplus.
9.2 The Efficiency of a Competitive Market:
By economic efficiency, we will focus and try to understand the total outcome a market can achieve through the maximum assemblage of both consumer and producer surplus. Price control is the reason behind deadweight loss. It is an efficiency cost decided by that policy, keeping the objectives of both policymakers and consumers in mind. By this efficiency cost both producer and consumer surpluses are decreased with the same value of deadweight loss.
What is market failure and how does it occur?
In some cases, reaching the market efficiency is the only purpose of competitive markets. That is why some of the participants feel less interested and sought to leave it aside. But this might not be the situation for all instances. Market failure occurs when both consumers and producers fail to aggregate their consumer and producer surpluses to the maximum level. The reason is definitely because there are not enough potential with the current market price.
Two most common instances of market failures are:
- Externalities:
Sometimes consumers or producers gain some benefits through their actions and that too outside market cost. For example when a producer uses chemicals to improve their product qualities, environmental pollutions and the cost to pay for it is unnoticed and received by the producer instead. It is only when Government interference with such benefits; they have to share from the cost they earned to social cost of pollution. This is an example of externalities.
- Not getting proper information:
This is another example of market failure when any consumer fails to make decisions on purchases after considering the quality or condition of the products. Government involves into this matter for helping consumers and letting them know on utility maximization concepts. An example of such Government intervention is requirement of true information in labeling.
When both of the externalities and lack of information don’t exist in a competitive market then even in an unregulated condition it will reach the level of efficient output. We will now consider the following diagram and the example where price is forcefully handled to behave like something else in the presence of equilibrium market clearing rate.
What we already know is that if price is forcefully kept under market clearing price then we have the result of price ceiling. Their production will drop and due to that total loss of both consumer and producer surpluses deadweight loss occurs. Since the production quantity drops lower than normal circumstances then this affects both consumer and producer net benefits.
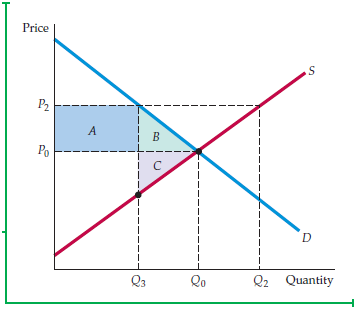
Consider the following diagram:
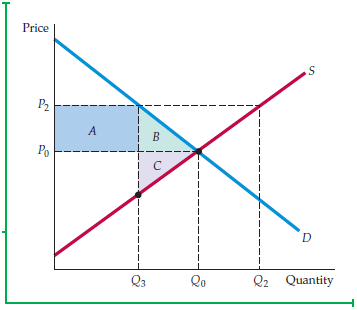
Now suppose Government have made a decision over price to be above market clearing rate, here P2 which was before P0, then we get:
- Producers ready to manufacture goods from Q2 to Q0 because of the high price rate.
- Consumers will be purchasing less from Q0 to Q3.
If we take that producers will produce the amount of goods that they can sell then it will be Q3 which is again a net loss in surplus.
- In the diagram above, rectangle ‘A’ will now stand for producers who are gaining benefits for remaining in the market even after higher price rate.
- Loss of consumer surplus will be presented by triangle ‘B’ because of some consumers who couldn’t stay in market due to high price.
- Loss of producer surplus will be shown by triangle ‘C’ for producers who cannot manufacture goods anymore due to high price rate.
- Both of these triangles will stand for deadweight loss.
Actually here, the triangle B and C are placed on the diagram rather having a positive estimation on efficiency cost that is forcefully increased above market clearing price rate. We can find it through these two examples:
- In real time situations, some producers will be attracted by high price and end up producing more than demand level. The result is unsold goods.
- In some other cases, those unsold goods are bought by government only to retain production level.
Both of these situations are indicating total welfare loss which is bigger than triangle B and C above.
In next few chapters we are going to find:
- Minimum prices
- Price supports
- Related policies etc.
Analysis of supply and demand is going to be useful tool for understanding these policies. You can learn how some alterations in a competitive market in their equilibrium state can be affecting efficiency costs.
9.3 Minimum Prices:
We have already discussed that through government policies, increasing price level over market clearance is possible. Often this policy is well-received rather than lowering the price rate from market clearance. Through government intervention raising prices above market clearance is possible. It simply makes the law where lower prices than market clearing price rate will be identified as illegal.
In the above diagram, we have found that producers will be able to sell Q3 amount of goods at a high price rate. Triangles B and C are standing for net welfare loss. But what if the producers don’t stop at the output level Q3 and start producing more with an idea that they can sell them?
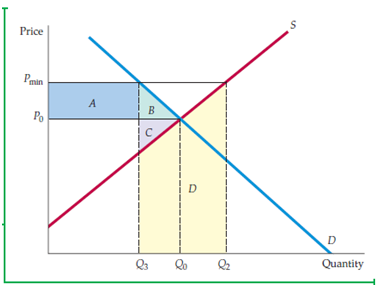
So now we come to the following diagram:
What we find here are:
- Pmin is representing minimum price rate that is decided via government decisions.
- The producers are now supplying Q2.
- The consumers are demanding Q3 amount of goods.
- The gap between Q2 and Q3 is now standing for excess goods that are yet to be sold or unsold.
Now we can find the results upon consumer and producer surpluses:
Variation in consumer surplus:
Those buyers who can still get goods at a higher price are losing their consumer surplus which is shown by rectangle A. Some of the consumers are feeling less interested to compete in such high priced goods and so they leave the market. That particular loss of consumer surplus is denoted by triangle B. Consumers are definitely remaining in the worse off condition.
Variation in producer surplus:
Producers are now getting benefits for selling goods in higher price which is shown by rectangle A. This is standing for transferring money from the side of consumer surplus to producer surplus.
There will be a loss in producer surplus from selling lesser amount of goods Q0 to Q3. This loss will be shown by triangle C.
But there will be no profit received from the unsold goods. The producers will produce Q2 amount of goods whereas Q3 amount of goods is sold. The lost cost required for the excess goods should be measured.
Supply curve is the solution. Since that curve is representative of aggregate marginal cost in the total numbers of industries participating in the competitive market, so it will be able to provide the amount of extra cost required for producing each unit. So in the diagram you can find the area D which is standing for extra cost needed for producing Q2 – Q3. We have now:
ΔPS = A – C – D
You must remember this might not appear when producers will cut down their production for avoiding an excess amount of unsold goods.
This trapezoid D is large in area and can actually be referring a large amount of producer’s loss in surplus. This will definitely lead to reduction of producer’s benefits for the cost required in manufacturing excess goods.
Minimum wage law:
Minimum wage law can be recognized as another example of minimum price rate set by government. We will consider the diagram below:
What we find here:
- The wage is decided wmin.
- Market clearing rate is w0 which is lower than wmin.
- Labors that can get the job will be paid with higher rates. But again some labors will not get the chance. So there will be unemployment.
- The diagram is showing L2 – L1 which stands for unemployment in this example.
This matter will be described in chapter 14 in detail.
Links of Previous Main Topic:-
- Introduction Markets and Prices Preliminaries
- The Basics of Supply And Demand
- Consumer Behavior
- Appendix to Chapter 4 Demand Theory a Mathematical Treatment
- Uncertainty and Consumer Behavior
- Production
- The Cost of Production
- Production and Cost Theory A Mathematical Treatment
- Cost in the Long Run
- The Cost of Production Production with Two Outputs
- Profit Maximization and Competitive Supply
Links of Next Microeconomics Topics:-


