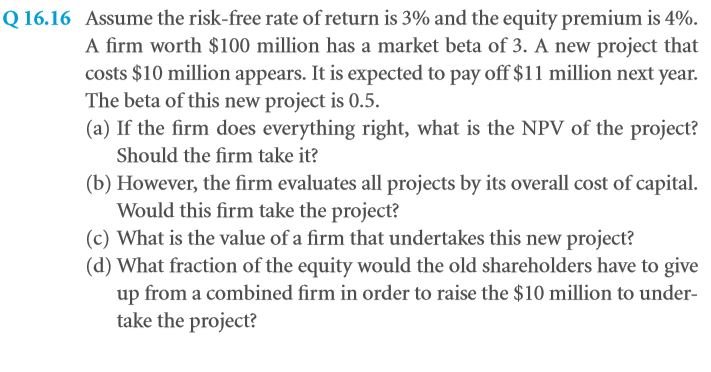
If you consider a market that is perfect, then the net worth of a particular firm certainly has nothing to do with the manner in which the firm is financed. This is one of the key aspects as far as this chapter is concerned. In order words, the capital cost is independent of the ratio of the debt. This has been illustrated in details already under section 6.4. The difference here is that the return rate is proportional to the risk. Hence, the current information on PV ought to suffice as far as the scope of this chapter goes. WACC stands for Weighted Average Cost of Capital. The thing about these examples is that it clarify any remaining doubts on the topic. You ought to receive the general formula for the same in the next chapter.
16.4 A an Example in a Risk-Averse World in Which Riskier Securities Must Offer Higher Expected Rates of Return
If you consider scenarios where in the risk factor is averted, then you might as well apply the rules that were taught under the chapter 6.4. The example of the payoff table for a building in chapter 6.4 applies to companies and firms as well. Under conditions of risk aversion, the claims where the risk involved is more comes with a higher interest rates and vice versa. If you have gone through chapter 15 thoroughly, then you must be aware of the fact that the contingencies of equity and debt on the projects is considerably high. Now let us take up the example of a corporation. Let the structure be similar to that of a building. The corporation is subject to both the favorable and the unfavorable conditions that may be encountered and the rates are placed accordingly. There are various parameters that need to be considered, some of the major ones are given below:
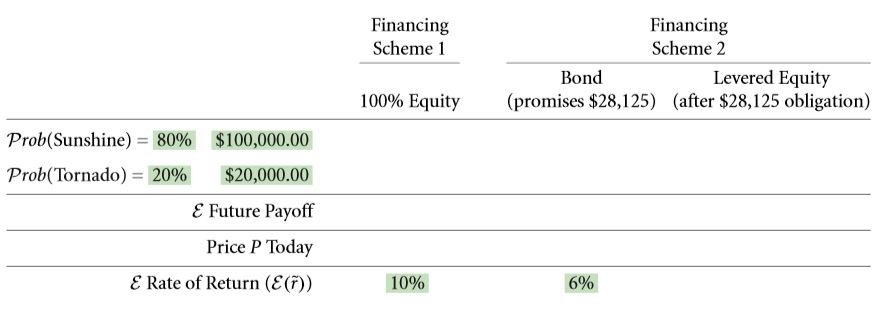
- Let the ratio of the probabilities of the sun shining and the tornado striking be 4 : 1.
- The corresponding value of the corporation ought to be $ 100,000 and $ 20,000 respectively.
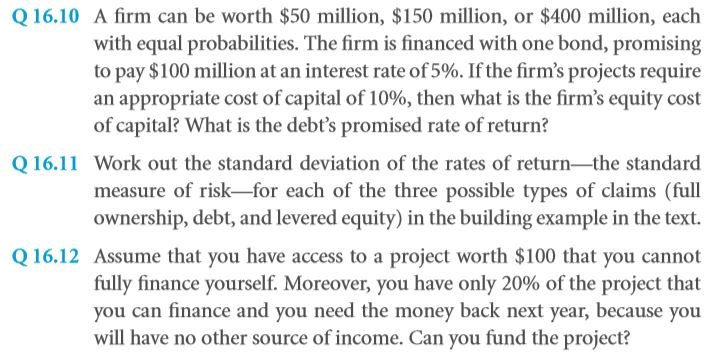
- Considering such a scenario, the rate charged will be 10 %. As calculated in the previous chapters, the worth of the building in such a scenario ought to be $ 76,363.64.
The only difference here lies in the fact that the expected rate of return in this case is comparatively lower than earlier. This means that a scenario of risk aversion is being considered. Suppose a bond for a particular building has a promised return of $ 28, 125. It demands a return rate of six percent. This rate without a doubt is much higher than scenarios where in the risk involved is lesser than this case. The various inputs for this example are given below:
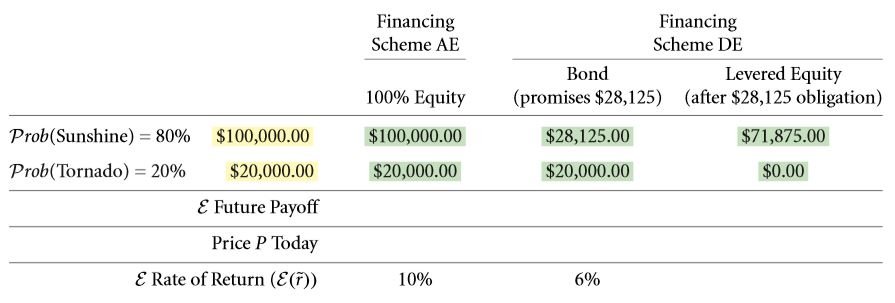
The primary task here is to determine the pay offs that are dependent on the various states. The capital cost of the equity which is levered is to be calculated by following the steps given below:
- The first and foremost step requires you to calculate the amount received by an owner in the event that he or she owns an entire building, i.e. a scenario of 100 % equity. In addition to this, the return expected for a promised value of $ 28,125 to the holders of the bonds must be computed as well. This step is illustrated below for the given example:
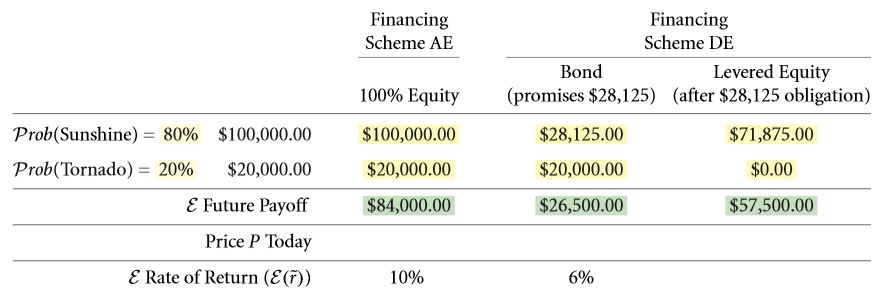
- The value that is expected for individual claims must be determined. While doing so, the probabilities of both the favorable and the adverse conditions must be taken into consideration. Bond value plus stock value must be equal to the value of the building.
- Then the discount rates are applied correspondingly.
- The assumptions of M & M are taken into account. This means that taxes, transaction costs, etc. are not application on any transactions. In case of cent percent equity financing, the same equations hold. Next, follow the steps as shown below:
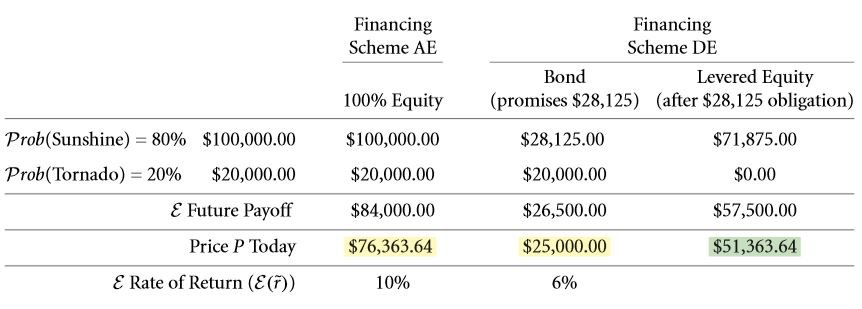
- Expected return rate = 11.95 % for an equity ownership that is levered. The payoff is $ 57,500 for a selling price of $ 51,363.64.
If the claim worth’s for the various circumstances are provided, the return rate can be computed:
In the beginning, only the capital costs were known, i.e. 0.1 and that of the firm would be 0.06. From these inputs, the equity of the firm that was levered was calculated to be 0.1195. The example in the table 6.3 illustrated the same for an environment that is risk neutral where the return rates were + 0.3993 or -1 in case of an equity that was levered. In case of equity that isn’t levered, it would be – 0.7381 or + 0.3095. This without a doubt is a lot more riskier in comparison with that of a loan that is corporate with return rate of either – 0.2 or + 0.125. However there was no impact of this on the expected return rate. If you consider the levered and unlevered ownership of equity. The capital cost for the first is higher than that of the second. The exact value of this change in the expected return rate cam be computed. Consider the CAPM model in the chapter 16.4 D.
SOLVE NOW
16.4 B the WACC Formula (Without Taxes)
Let us now consider a scenario that is independent of the manner in which the equity and the debt is distributed, namely the WACC. WACC stands for weighted average cost of capital. The example used earlier takes us into the topic of WACC. It is the capital cost of the claims of a firm that are nothing but the weighted average value. This is due to the fact that the firm’s value depends on the various assets that the firm contain and not the manner of distribution of equity and debt. As per the theoretical point of view, the value of a firm must be equivalent to the summation of the value of the stocks and the bonds.
In the event that WACC is considered to be constant, the only thing that could make it possible is the inter dependencies of the various equities, debts and the value of the entire firm. If any two of them are unknown, the third can be computed quite easily. Let us now consider the previous example in terms of WACC irrespective of whether the sun shines or the tornado strikes.
This illustrates our statement even further.
The expected return rate and the PV can be expressed at interval 0 and 1 respectively.
In the event that you wish to make the above equation look a lot simpler, you might as well avoid the subscripts of time. The complexity has been reduced by taking two separate instances of time only. One can further convert this into percentage terms for better understanding in the following manner:
The current value of equity divided by the current firm value gives us the current value of the firm. Hence, the formula can be further expressed as:
The % of weights are then multiplied in the following manner:
Since the firm is owned by both equity and debt, their summation is equal to 1. As a result the 1 in the R. H. S. is cancelled out. Thus the WACC equation is obtained:
An operation of expectation in front of the equation is implied as the capital cost itself is the return rate. If you are wondering as to what the effect of taxes and other distortions of the market will be on this equation, there no need to worry. All of these issues have been discussed in details under the chapters that are to follow.
16.4 C How the Cost of Capital and Quoted Interest Rates Vary With Leverage
By now, the students must be well acquainted with the steps they need to follow in the event that the capital costs need to be calculated. Now we will be discussing the topic in greater details so as to ensure that no portion of the subject remains untouched. The impact of changes in the structure of capital on the security of an individual ought to be focused on. To do so we will be going back to a previous example.
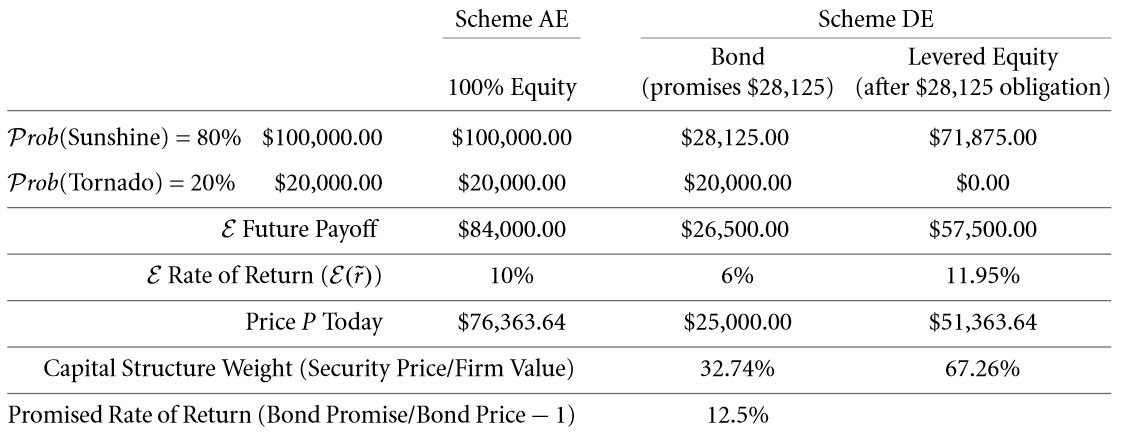
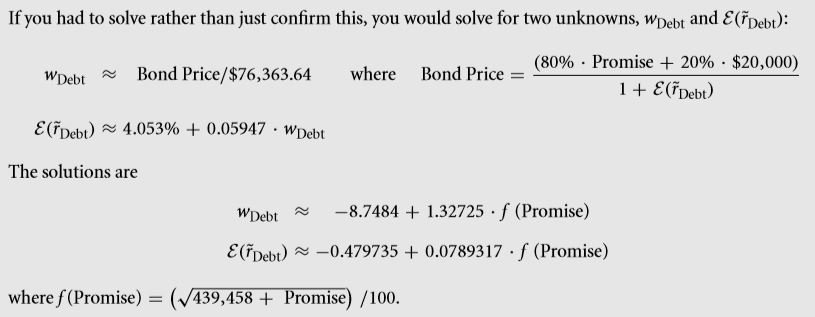
The question that ordinarily pops up in the mind of most students at this point in the how does the change in the amount that is being borrowed effect the expected and promised return rate and the ratio of debt to equity. There are few aspects of this chapter that ought to be very clear to students. Let’s get into another example. Let the return rate be about six percent. And the promised value of the debt be $ 28,125. This can in turn be carried out if the return rate that is free from any sort of risks is changed to 0.0555. Now what you must do is increment the capital debt expenses when the promised amount exceeds twenty thousand dollars. This can be increased to about 0.1 in the event that the entire property is put in. The formula can be reduced to:
This is only applicable in the event that the rate that is calculated exceeds 0.0555. This can be further used to calculate the given example again for various structures and aversions of the capital.
The effect of cent percent equity can also be computed. Capital cost must be 0.1.
Solve few more problems in the same manner. If the promised amount be about ten
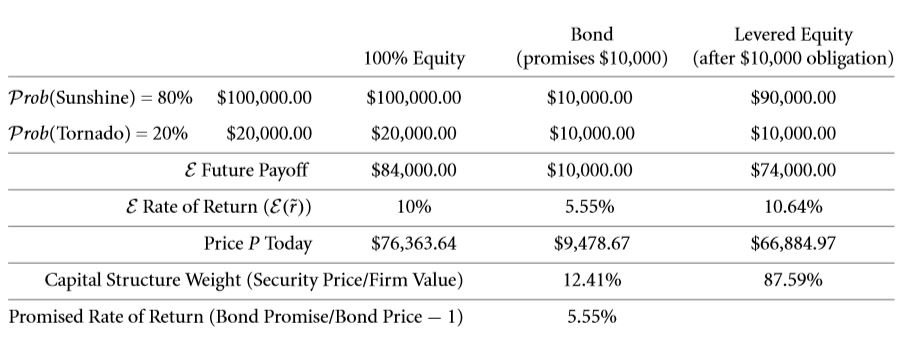
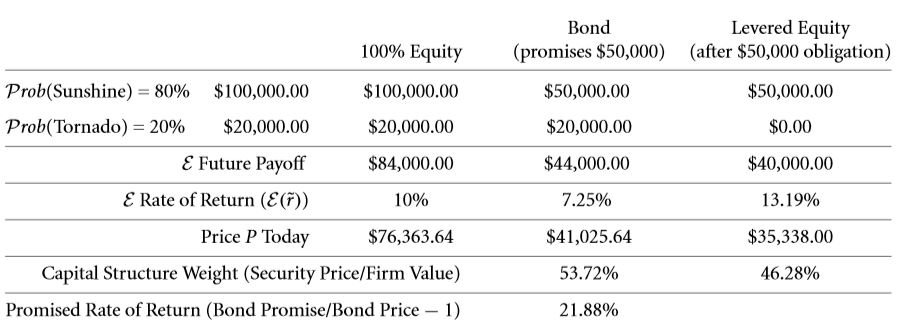
In case of a risky debt that promises fifty thousand dollars, then 0.0725. According to this, the table can be altered as follows:
If you have computed the result for all the examples that have been considers, then you might as well verify them:
DIGGING DEEPER
HOW BAD ARE MISTAKES?
IF ALL SECURITIES ARE RISKIER, IS THE FIRM RISKIER?
Is the capital cost of a firm directly proportional to the amount of debt that has been taken? There are various critical faults that professionals in the field tend to commit. Some of the major arguable topics are as follow:
- In the event of a greater debt, the risk involved in holding an equity increases which in turn results in an increase in the capital cost.
- More the debt, more will be the risk and in turn the capital cost will be more.
- BY now, individuals have the clear idea that a company or a firm is mainly composed of 2 aspects, namely, equity and debt. As a result, if more amount of money is borrowed, the capital cost may tend to exaggerate.
Among the three arguable topic mentioned above, all are correct except for the last one. Well, there are various reasons behind this which have already been discussed in details under the scope of the previous chapter. The risk involved as far as an equity is concerned tends to increase in the event that more money is being borrowed. This is due to the fact that with more money being borrowed, the corresponding weight of a particular debt tends to increase. On the other hand as far as the equity weight is concerned, it tends to decrease. This is due to the fact the capital cost for a particular debt is often less than that for an equity. However, the sum of these costed raised to power remains constant.
From the above date it is quite clear that the 1st 2 statements are absolutely correct. However, I certainly can’t say the same for the third. The capital costs involved in both equity and debt are higher, however, the net capital cost remains unaltered. This is what M & M proposed, i.e. capital cost doesn’t have any sort of dependencies with equity or debt.
The Summary Graphs
The return rate that are expected are plotted along the y – axis and the promised value is plotted along the x axis. If you observe the graph carefully, you ought to notice that it comprises of three distinct regions. The figure given below contains the debt ratios for a large number of entries.
The three domains are discussed in details below:
- The first is the debt domain that is free from any sort of risks. Here the promised value to the creditors is a maximum of twenty thousand dollars. Since it is debt free, the creditor is entitled to 0.0555. This value is applicable to all firms of loans whose loan amount is currently less than $ 18, 948. If you observe the graph thoroughly, you ought to figure out that the return rate that is expected for an equity varies as far as this section of the graph is concerned. The ten percent return is only provided in the event that the amount of debt involved is zero.
- The second region is a risky one where in both the equity and the debt are at risk. According to these statistics, a debt is considered to be risky only in the event that the debt amount is greater than $ 18,948.37 at present. The thing about this region of the graph is that both the bondholders and the shareholders get a greater return rate or at least they are expected to get. However, the value of the summation of the capital costs raised to power is still 0.1. If is due to the fact that the higher return equity is inversely proportional to the ratio of the debt.
- The third region in the graph depicts a scenario where in the entire firm is owned by debt, i.e. cent percent debt. Suppose the firm has a promised value of hundred thousand dollars, the owners of the equity don’t benefit at all. The capital cost is now taken to be 0.1. However, if the firm makes a promise of more than hundred thousand dollars then the offer might as well be ignored.
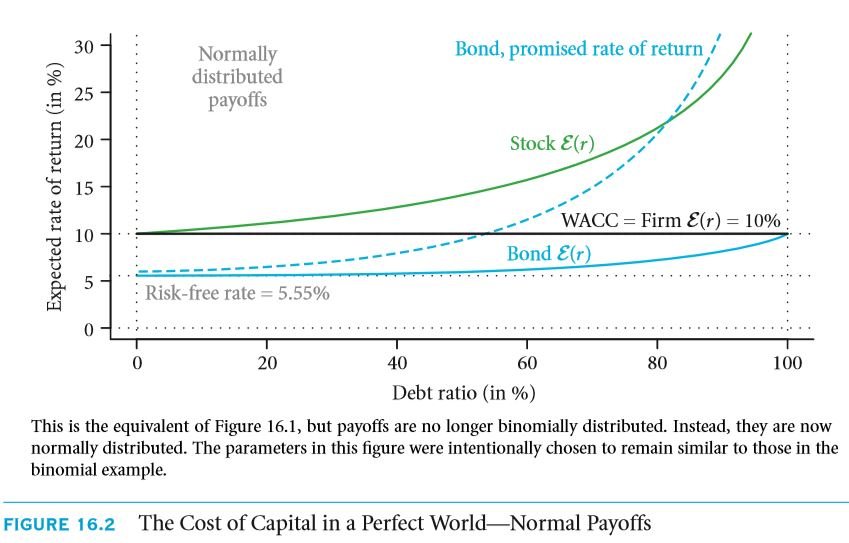
If you compare figure 6.1 and real life values, the graph will not be similar in all aspects. This is due to the fact that the example that has been considered in this case is not possible in real life. This refers to the fact that as far as the circumstances are concerned, the firm had only 2 possible outcomes, i.e. it is a binomial. If the pay offs for a particular firm are distributed evenly, then it can be considered to be somewhat less abnormal. For such an example, you might as well refer to the graph in the figure 6.2. It shows a pay of eighty four thousand dollars and has an SD of thirty two thousand dollars. Though this example is quite similar to figure 6.1, however, in this case, the number of possibilities is not restricted to 2. The process is same as before. The only change lies in the fact that the number of cases have increased. Since the possibility of the value of a firm being zero exists, therefore, no bond can be issued that is free from any sort of risk. Risks must definitely be involved as far as the various bonds are concerned. Thus the risk free region of the graph in figure 6.1 has been totally removed. However, there can be regions where the risk involved is negligible in the event that the debt ratio is about 2 : 5. This is something that is extremely common in today’s world. Thus, you can now relate the risk free world with the real world. This was the sole objective of discussing the risk free world in the first place. However, the fact remains that individuals are still a part of the perfect world. Hence, irrespective of the structure of the capital cost, the capital cost is still 0.1.
HOW BAD ARE MISTAKES?
Can the equity’s cost of capital be lower than the rate that the firm is paying to its creditors? Can the equity’s cost of capital be lower than the rate that the firm is paying to its creditors?
Considering the various mistakes related to the capital costs, the return rates that are to be promised are a subject to rise. By now, you must be well aware of the fact that cost of capital for a debt is always lower than that for an equity. The question that ought to pop up now is whether or not the capital cost can be lesser than the rate of interest. This is the point where the owners must be extremely careful as they must figure out the rates that the investors are looking forward to. In the figure 16.2 it is clearly visible that the bonds return rate rises drastically. As the risk involved for a particular firm increases, the promised rate of return must also increase. This is something that isn’t going to change. Something has to be present that would compensate for the increased risk. A most common mistake that investors tend to make is that they entirely focus on the return rates that have been promised and not on the rates that he or she is expected to receive. Under such circumstances, the investor may incur heavy losses. The CAPM capital cost is the figure 16.1 is about 0.1195 for an equity which is without a doubt much less than the interest rate that has been quoted. These are certain critical aspects in the field of finance which in no way can be ignored. The quoted interest rate of 0.125 is more. In brief, I ought to put forth the concept that in the real world scenarios, the quoted rate of interest is mostly greater than that of the capital cost involved in equity.
SOLVE NOW
16.4 D THE CAPM, WACC, AND NPV—A SEAMLESS FIT
What we have studied till now doesn’t explain how the 3 aspects in the subhead can fit in without much of a hassle. Well, there’s absolutely no need for you to worry. This section will be clearly explaining how it has been made possible. A major conclusion that can be drawn here is that 0.06 and 0.1195 on the debt and equity respectively is without a doubt calculated taking into the account what the investors demands. By now you must be expecting that the theoretical values overlap as well. In the event that the theatrical values vary greatly, you are certainly in some trouble. A major question that ought to pop up is the reason behind the overlap of the demand and supply. Without a doubt this is only possible if the CAPM model is followed.
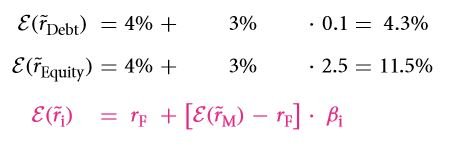
Thankfully for you, the values actually overlap. Provided you have carried out all the calculations correctly. All the 3, WACC, NPC and CAPM can be combined together. The fact is that these three actually perform quite well when they are together. CAPM comes in handy at the time of computing the return rates that were expected on equity as well as on debt. The summation of the values raised to power is in turn used to get the WACC which is in turn the denominator if you look at the formula for NPV. There actually go hand in hand. Let 0.1 be the market beta for a debt that is taken at a low risk. The worth of the debt is four hundred dollars at present. However if the beta rises to two and a half, the equity would have a value of two hundred and fifty dollars. The return rate in an environment that is free from all sorts of risks is 0.04 and the premium for the equity is 0.03.
Let’s us first compute the return rate that is not only expected by is appropriate at the same time both for equity and debt. The return rates are calculated using the CAPM as follows:
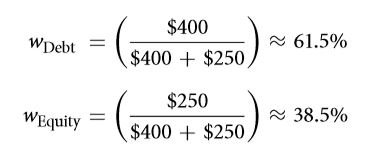
Next the claim weight are to be calculated as follows is accordance with the structure of the capital:
The capital cost is then calculated:
If you aren’t comfortable with this method you might as well try another one that is discussed below:
This in turn tells us that the capital cost would be:
The standard method yielded a capital cost value which is equal to what be obtained from this method as well.
As far as the project of firm type are concerned, this capital cost can very well be used. It can also be used in the event that the owner or the manager is looking forward to put discounts on the flow of cash. For instance, let’s consider a project that brings a revenue of about eight hundred dollars at a probability of 0.48 and a revenue of six hundred dollars at a probability of 0.52. Well, in the problem:
Here the flow of cash that was being expected is adjusted in order to get the desired value. A question that often pops up is whether or not the WACC is the average of the rate of interest raised to power and the expected return rate as far as the equity is concerned? Well, the answer to this question is definitely NO. As far as the rate of interest quoted by the bank it concerned, it is the return rate that was promised on the debt. However, the rate of interest that is used in the WACC is comparatively higher than this as a result of the premium that is default. The question remains, how can the return rate that is expected for a debt be computed? Well, the process is same as that of calculating the same for an equity or any sort of other claims having a financial background. The CAPM structure is often used as well in order to cope up with the complexity. This task however isn’t always easy. There are several aspects that need to be considered such as the risk involved and the premium that is default. This scenario allows us to work with an expected return rate which is close to the rate under a risk free environment.
DIGGING DEEPER
As far as the perfect market is concerned, it can be proven that the WACC, the CAPM and the adjust value for debt ratio are quite compatible with one another as far as the perfect world is concerned. The WACC equation has been obtained under the scope of this chapter.
This is the exact equation that we had obtained in 9.2. This equation is one of the few that connects the various betas. The three equations share the same base. However, the claims and firms whose beta value is higher is considered to be more risky. As a result, the return rate that is expected must be higher than usual.
16.4 E THE EFFECT OF DEBT ON EARNINGS PER SHARE AND PRICE/EARNINGS RATIOS
Do you know what EPS is? Well, the term EPS stands for Earnings per Share. Have you wondered what would be the impact of debt on the EPS? Well, this question is absolutely baseless as EPS is proportional with the share number and not with any other characteristic of the firm. There have been scenarios where in the number of shares vary yet the capital structure remains the same. If the EPS is about seven dollars per share, then it may be said that $7,000,000 equity value has hundred thousand shares. This has already been discussed in details under the scope of the chapter 14.3 D but there no explanations were given. The propositions of M & M weren’t known yet they were followed then. The ratio of P to E might vary as well.
Links of Previous Main Topic:-
- Introduction of corporate finance
- The time value of money and net present value
- Stock and bond valuation annuities and perpetuities
- A first encounter with capital budgeting rules
- Working with time varying rates of return
- Uncertainty default and risk
- Risk and return risk aversion in a perfect market
- Investor choice risk and reward
- The capital asset pricing model
- Market imperfections
- Capital structure and capital budgeting in a perfect market
Links of Next Financial Accounting Topics:-
