When a production process takes place, there are multiple aspects that need to be taken into consideration. Starting from what volume is to be produced to what would be the adequate price for that and finally, total profits that are ascertained in production of that product. To ensure that this computation of data is done in the best manner, it is important that there be certain tools that provide an analysis of these data.
This analytical tool can be defined as cost volume profit analysis.
Understanding the cost-profit-volume analysis:
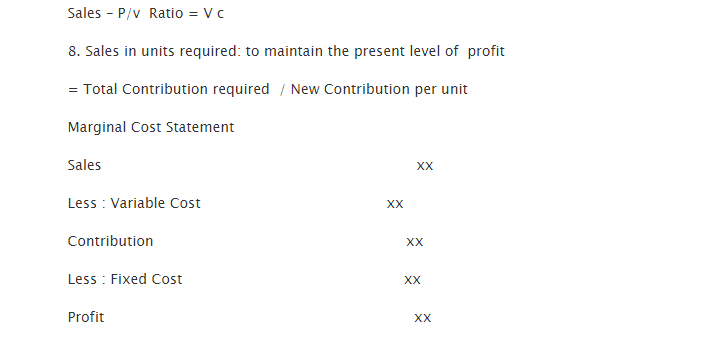
This is an analytical tool with the help of which, relation between volume, cost, profit and price of a product can be determined. With help of this, variations in regards to these facets of production are measured analytically.
Heiser defines this tool as, the sole factor that is associated with profit planning in regards to this business is relation between volumes of business costs and profits incurred.
Facets of study in this analysis:
To understand this above mentioned relation in a detailed manner, it is important to study certain points:
- Marginal cost formula
- Analysis of break-even point
- Profit graph
- Sales mix
- Ratio between profit and volume
There are times when the management wishes to know of the profitability of a particular product. In such a scenario, taking help from such analysis is extremely helpful.
Understanding the various points to be noted:
Profit Volume Ratio:
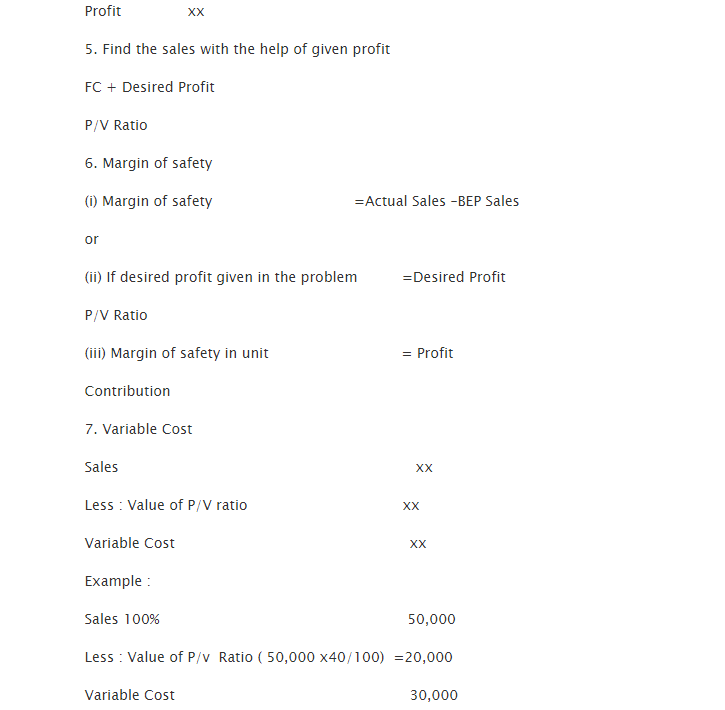
Having a very important role in decision making, this is used for calculating BEP and other aspects associated with profit and sales relation. With a high PV ratio, a company can obtain higher profits and vice versa.
Margin of Safety:
This can be clearly defined as extra production or actual sales over break even production or sales in case of a selected activity.
Break Even Analysis:
This is the most important financial tool that determines the impact on profit, costs of price and sales, and changes in volume of production. With help of this tool, levels of efficiency can be measured in the most accurate manner.
Break Even Chart:
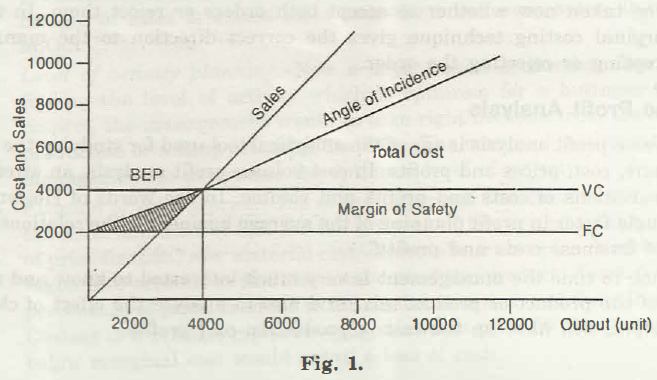
The graphical representation of break-even point is known as break even chart. According to Dr. Vance, ‘’This graph specifically shows the amount of fixed variable costs along with sales revenue that is garnered at specific operative volumes. It also depicts that point when the firm covers all costs associated with break-even revenue.
Presumptions made with break-even analysis:
- In this case total, fixed costs are same throughout the process.
- There is strict difference between fixed costs and variable costs.
- Variable costs change with level of output volume.
- It is taken that production volume is equal to sales volume with no stock leftover.
- Also selling price and operational efficiency remains constant.
- There is no change detected in general price level
- It is the volume of production and output that is associated with determining the cost and revenue of the product.
- In this case, only a singular product is considered.
Positives associated with Break Even Analysis and Chart:
- This provides an accurate idea of fixed and variable costs
- In this case, comparison between firms can be taken
- This helps in choosing the best promotion and product mix
- It provides detailed and authentic balance sheet information along with profit and loss details.
- It helps in forming flexible budgets and controls price policy and cost controlling
- At various levels profits can be calculated
Limitations of Break Even Analysis and Chart:

- The point of opening and closing of stocks are negated.
- In case of break-even point, detailed information is not found.
- Only the sales and product mix is taken into consideration
- Whereas fixed costs do not remain constant, similarly variable costs and sales revenue,do not vary in a proportionate manner.
- The economics of scale of production is ignored completely
BEP = Fixed Cost x Sales
Sales – Variable Cost
Angle of Incidence:
This is an angle that is formed at the break-even point in a graph, where sales line cut off the total cost line showing the profit earning capacity. Profit is proportionate to the angle of incidence.
Links of Previous Main Topic:-
- Introduction to accounting and branches of accounting
- Preparation of final accounts
- Introduction of fund flow statement
- Introduction cash flow statement
- Ratio analysis significance of ratio analysis
- Fixed assets and depreciation meaning causes objectives methods and basic factor
- Cost accounting concept objectives advantages limitations general principles and cost sheet
- Job costing
- Introduction process costing
- Activity based costing introduction concept and classification
- Introduction inventory pricing and valuation
- Standard costing introduction
- Management accounting
- Marginal costing
Links of Next Finance Topics:-
- Cost volume profit analysis
- Test questions of marginal costing
- Relevant cost for decision making
- Budget and budgetary control
- Limitations of historical accounting
- Introduction to responsibility accounting
- Introduction to financial management
- Introduction and types of dividend
- Concept of cost of capital
- Capitalization meaning
- Concepts of working capital
- Concept of capital expenditure
- Learning objectives and chapter outline
- Limitations of operations research
- Linear programming learning objectives and outline of chapter


