Going on to the second goal which is determination of cash flow is expected from the beginning of the business growth to the years of the forecast of terminal. And if you are the analyst of this business, the predictions for you will be pretty easy. In order to forecast the same for a company like Pepsi Co, you can take help from historical data but you need understanding about the business with underlying economics which includes information like corporate balance sheets of current and previous years, economics of the specific industry and so on.
But the process is not that simple. And even if you can get such information it will not be helpful for other businesses as they are company specific information.
Under the absence of inside information, the accuracy in the detailed forecast have a greater impact on the wealth of the project under two channels:
- Forecast of the initial 3 years of the company has a direct contribution to the value of the firm currently.
- The terminal value is directly linked to the base line of the company.
Let’s start with estimation that will help in illustrating the process further. It is explained in the following two different sections:
- Direct estimation or we can say, extrapolation of component of accounting which is needed: This step is generally used as a shortcut for analyst when they have limited time and information about the project
- Financial modeling of the statements or items mentioned in financial statements: This is a common method used in real world.
20.4 A: Faking It: Direct Extrapolation of Historical Cash Flows
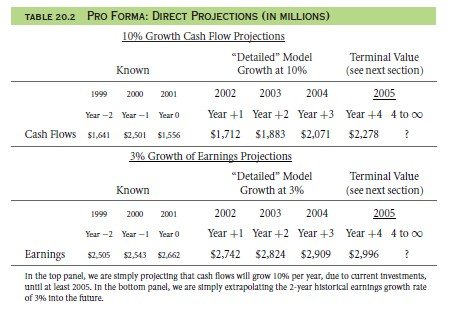
First method mentioned before is generally cheated which is commonly practiced by everyone. This method will provide you cash flows from the historical data under the assumption of constant rate of growth. Unsung the formula, we can calculate the cash flows under the presence of debt and equity:
Here, we can notice that the decline of cash flow over 3 years is around -5.2%, which means that is annual decline is -2.6%. Also, there is a 1/3rd drop in the cash flow of assets in 12 months recently. After the investigation, one can notice that decline of Pepsi Co. was because of the investing activity which is increased in the years. Somewhere these statements seem unreal, isn’t it?
And that’s why one must know the detailed information about the business and their serious reasons behind the trends in finances. The information also involves economic information and some common sense too! Let’s consider the growth rate as 10% and the projection of the same can be noticed in Table 20.2 after adopting such a projection which is quite different in the case of Pepsi Co. and their statements in recent years.
Now the question is if the present value of the cash flow in future can be represented by net income growth of historical data or by cash flow in historical data.
Net Income: Talking about the positive side: cash flows are less smooth than earnings. Negative side is served by: the discounts are generally wrong as they are applied on the combination of cash of future and real.
Cash Flows: Positive side is that they are standardized if one can predict the same accurately. Negative side: the historical data cannot be trusted in order to realize the real picture in the future.
20.4 B the Real Thing: Detailed Financial Pro Forma Projections
How about projecting financial statements entirely in order to project the economic cash flows suggest? This is hence the common second method to do so. This process will involve components seeking he cash flows of the economics. Why, if you ask? Because:
- Reliability is not justified by cash flow and forecast of earnings.
- This method will help you understand the underlying stable business and inside information for the estimation of cash flow of economy.
- This method will help you project information like availability of working capital, ratio of debt and equity and covered rate of interest. These analyses in the ratios are helpful in judging the correct path of the firm.
The Income Statement: Sales
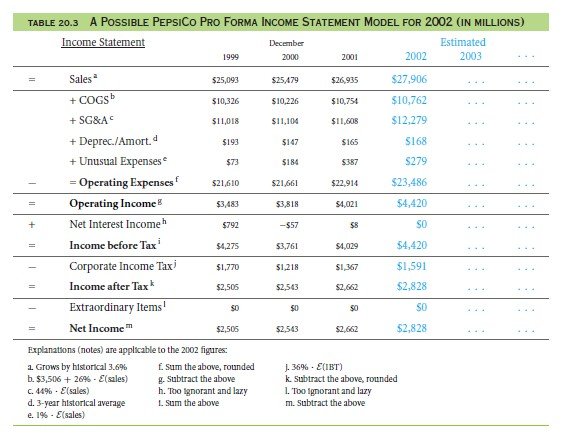
Sale forecast is thus the most crucial aspect in creating a professional pro forma as it is helpful in creating the base line for forecasting of other financial items. Considering the case of Pepsi Co, table no. 20.3 will help you to dictate the sales of the firm at the rate of annual: ($26,935/$25,093)1/2 − 1 ≈3.61% from the year 1999 to 2001. In 2002, you will predict the sales growth as: $26,935
($26,935/$25,093)1/2 ≈$26,935
(1 + 3.61%) ≈ $27,906 million
The forecast of sale requires a footnote in order to state the explanation of the estimation and one can notice the same in the table. Please note that such a forecasting of sale is not simple as that is made of always and thus one must use economic modular structure that includes detailed intelligence of business.
The Income Statement: Other Components
Income statement will require going down and investigating product by product. The next estimate will entitled for COGS. The options are various which includes forecast of plain growth as well. One can use the following five methods to forecast the same:
- Plain Growth Forecast: Repeating the same exercise of sales for COGS will lead to
The Growth rate that is of historical ($10,754/ $10,326)1/2 − 1 ≈ 2.05% to be continues in the year 2002.
If we apply the same for the year 2001: $10,754, your 2002 COGS forecast will be $10,754 . (1 + 2.05%) ≈ $10,975
- A pure proportion of sales Forecast: The COGS forecast will be
- An economies-of-scale forecast: The COGS forecast will be:
E(COGS2002) = $3,500 + 25% . E(Sales2002)
= a + b .E(Sales2002)
E(COGS2002) ≈ $3,500 + 25% . $27,906 ≈ $10,477
- An industry-based forecast: Comparing the COGS of Pepsi Co, with Coca-Cola, we will notice that both the businesses are different, but Pepsi Co can realize better position by lowering their COGS to estimation from $10,762.
- A disaggregated forecast: one can notice that COGS include depreciation as well which means that the past capital of the company will affect the estimate value of COGS further. Formula can be generated by including statistical regression as the expenditures in the past capital.
The Cash Flow Statement
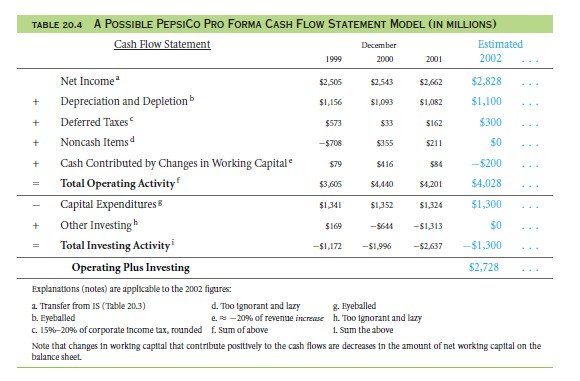
The next step here is modeling the statement of cash flow. Table 20.4 illustrates the same for the firm Pepsi Co. You can see that the initial step is served by transfer of net income projected from the income statement model of the pro forma to model of pro forma flow of cash. Since it’s an illustration, the cash flow items which are remaining are the estimated of the perfunctory.
The table does not include any information related to Pepsi Co. depletion and depreciation so we have assumed the number $ 1,100 million keeping in mind the standard of the company. Now, let’s keep 18% as the income tax paid by Pepsi Co. But one must keep a note on the changes in the capital working as they are closely related to the level of sales for the company.
As depicted, the sales of the year 2002 is just $ 1billion, this means that Pepsi Co needs more working capital. So, we can say here that Pepsi Co will experience reverse trends adding $ 200 million in the business for the growth in sales. So, we can say here after going through the entire table that $2.7 billion will be the outcome of investment in cash flow and operating of the company.
Financing Policy, the Balance Sheet, and Linkages
Most of the time analysts by pass to think about the policy of financing in the company. Please note that these policies affect the overall balance sheet as well as statement of cash flow and income too. As a matter of fact, if you ignore financing policies which are affecting the income statement, you might have to go back to the statements and change your forecast predictions.
20.4 C Ratio Calculations and Policity with Pro Formas
After projecting balance sheet & equity statement, up to the value of the terminal T, the question here is what to do with the same?
Economic Project Cash Flows
Projecting the value of the analysis is the first significant use of Pro Forma. One can compute the economic flow of cash for NPV analysis through cash flow statements of the year 2002. The economic flow of cash for the company Pepsi Co is that which sums up that of operating flow of cash and investing flow of cash subtracting the income of interest. So it will come up to about that value of $2,728 million from the table no. 20.2,
But in order to locate the answer of how much to invest will only be answered under the presence of detailed knowledge about the company and the associated statements.
Ratio and Soundness Analysis
Forward looking analysis of ratio is another useful projection by pro formas which helps in judging the viability and soundness of the company. If you want to check if your forecast is reasonable, this is where you will know! Taking an example, supposing if a firm is in non-working position or the ratio of debt or equity is high with very small amount of cash, such a scenario will help to set off the alarm on bad financial situations.
Corporate Policy Changes
Pro forma generally depends on the external factors like economy of the country but is closely related to the decision of managers too. Managers must aim to make a payment or to collect the bills along with investment information on how much of a sum to invest and where to invest. But if you are an external analyst who is projecting the pro forma for a company, it is important to collect the keen information like changes in policies or COGS sales, as changes in policy affects other items of financials deeply.
Such a scenario is easy to handle if the analysis is the owner or the internal analyst of the company. Under such cases, the prediction and seeking right information is easier.
Links of Previous Main Topic:-
- For value financial structure and corporate strategy analysis
- The goal and logic
- The template
- The length of the detailed projection period
Links of Next Financial Accounting Topics:-


