The Basics of Supply and Demand
Economics is very relevant in the modern world. The concept of demand and supply enforces this thought. This concept can actually be applied to numerous issues and problems faced in the world today. For e.g.: –
- The impact of Global economics conditions on market price and production
- Understanding price controls and supports, Government controls and incentives to evaluate a market
- The impact on producers and users by taxes, subsidies and tariffs
Let us commence by understanding the market mechanism with the help of demand and supply curves. By default, demand and its supply are in equilibrium which then determines the production units and its market price. However, this is only in the case where Government does not intervene with price cuts and subsidies or other such policies. The price and quantity so determined is still subject to other economic variables such as labor, aggregate economic activity and other characteristics of supply and demand. These economic variables are themselves changing.
Hence, studying the characteristics of supply and demand will help us in understanding many concepts such as: –
- Fluctuations in the pricing of basic commodities as compared to others in the same market
- Reason for less supply leading to shortages of goods
- How and why market gets affected whenever the Government makes a prediction about the economic future or is planning to change a policy
To better grasp such concepts we need to compare the characteristics of supply and demand among different markets as well.
Although, understanding qualitative determination of market price and quantity is very helpful, it is also important to analyze- these in terms of quantity. Changes in market conditions can be understood as well as predicted by simple and rough calculations.
We will also read about the impact which macroeconomic fluctuation (international and domestic) and government involvement has on market conditions. This will be portrayed through numerous easy to understand examples and charts. We would also encourage you to take part in exercises at the end of this module to confirm your understanding of this concept.
2.1 Demand and Supply
An important leg in Microeconomics is the concept of Demand and Supply. It is an imperative part of understanding price fluctuations and the impact of government interference. But before trying to understand these topics we need to learn about the basic demand curve and supply curve.
The Supply Curve
This curve shows the exact quantity which a supplier is willing to sell at any particular price. All other factors impacting the supply quantity are held constant to derive a true picture between price and quantity. It can easily be denoted by a formula: –
QS= QS(P)
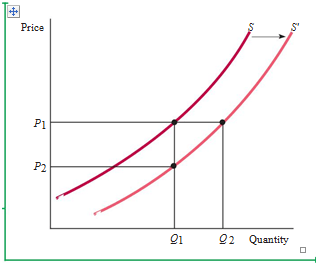
The graphic representation of this is shown below in Figure 1
In the above figure x axis denotes the Price of the goods and y axis is the quantity of goods offered for sale. S is the original supply curve and S’ is the new supply curve because of fluctuation in price resulting in a change in the quantity supplied. Q1is the original Quantity and Q2is the increase in Quantity supplied when the original Price P2increases to P1.
In the figure, the Supply Curve slopes upwards which states that with an increase in price, the suppliers are willing to produce and sell more quantity. There could be a number of reasons for this phenomenon. A supplier with the increased price would be able to sell more as he is able to expand production. He could hire more workers or pay the existing ones overtime. The supplier might even increase the plant size in the long run.
A higher price would also attract new entrants in the market which will again result to a swell in the quantity. The newcomers might get attracted by higher prices which usually result in higher profits. Earlier the interested firms must have found the start-up costs to be uneconomical. They would have not found the entry into the market conducive to their budget. However with the increase in price, they must have factored in the costs at last.
Other Variables
There are many variables other than price which can affect the supply of a product. In our earlier example, these variables were kept constant so as to derive a true relationship between Price and Quantity. However, the quantity of a good can also be affected by production costs such as labor wages, loan charges, raw material cost, electricity cost etc.
In Figure 1, the supply curve S is constant with particular costs for other variable factors. If we keep the Price at P1 the resultant quantity produced is Q1, however, this is in keeping other variables constant. Let’s think about cost of raw materials as the ‘other variable’. If the cost of raw material falls, what do you think would be the effect on the Supply curve?
A business is run for profit. Profit is when the income exceeds the expense on a product entailing all costs. When the cost of raw material falls it will always lead to the rise in the Quantity with no encouragement from the Market Price. This is because as the raw material costs drop, it gives more production power to a business, thus leading to an increase in the quantity produced and supplied. In the same figure, the supply curve shifts to the right from S to S’ and the quantity produced increases from Q1 to Q2. This further elaborates on the point that the quantity will increase when the production cost decreases, no matter what the market price is.
We can take a look at the same example with the viewpoint of a manufacture. Let’s backtrack on the price. Let’s imagine that the quantity produced by a firm stays at Q1. At this quantity as the cost of raw material is lower, a producer will readily accept the price P2. In this way we can again the judge the impact of a lower raw material cost. The supply curve without disappointing us will again shift towards the right at the same fixed quantity but at a lower price. This phenomenon can be checked again in Figure 1.
Bu judging these two phenomena we can safely say that there are two types of changes to a supply curve. One is where the whole supply curve shifts to the right and the other is in which there is movement of the focal point along the same supply curve. We have seen that the impact which change in price has on the quantity supplied can be seen by movements along the supply curve. This is termed by economists as a change in quantity supplied. However, the impact of changes in other variables which determine the supply production and invariably affect the quantity produced is shown by a complete shift of the supply curve. This is phrased as change in supply by the economists. The two terms are unique and not interchangeable.
The Demand Curve
A demand is the want of a consumer to purchase a particular good. The demand curve graphically represents the change in the quantity purchased by consumers as the price of the same quantity fluctuates. The relationship between the price and quantity demanded of a certain good can be described as:
QD= QD (P)
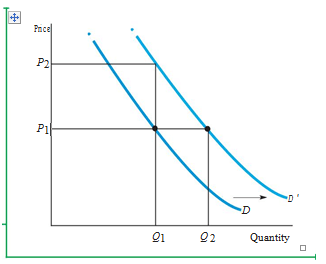
It can also be graphically represented in the same way as Figure 2. In this the demand curve labeled simply as ‘D’ slopes downwards. Usually in a market place keeping all other variables constant, a consumer definitely purchases more a certain good when the price is kept low. Certainly a low price attracts more customers to purchase large quantities as is shown by the demand curve. In the same way a low price might also attract other consumers which could not buy the product because of a high price. However, with the decrease in the price, these consumers now flock to buy large quantities.
Figure 2
Another important factor in determining this phenomenon is the income. Apart from pricing of a product the purchasing power of a consumer is very important and Income is the factor that determines it. There is a substantial increase in spending when the income of a person is more. It is the general attitude of consumers to spend their income on goods.
Shifting the Demand Curve
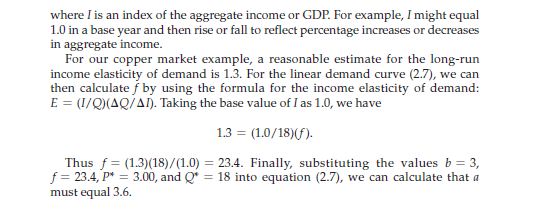
We can understand the shifting of demand curve better by keeping price constant and changing the income level. As seen in the figure, if the market price is kept constant at P1, there is still a significant increase in the Quantity demanded from Q1 to Q2. Now it will be easy to understand that increase in income actually affects in a major increase in quantity. This increase in quantity is not subject to the market price and with an increase in income the whole demand curve shifts to the right. In the figure it is labeled as D’.
The shift in demand curve due to an increase in income can be seen with an alternative example as well. As seen in Figure 2, keeping quantity constant at Q1, there can still be an increase in Price from P1 to P2. This is because when the income increases for a consumer, he is ready to pay more for a particular good. Again, as seen in the figure this would lead to a rightward shift of the demand curve.
As explained in supply, any change in the demand curve leading to its shifting will be termed as change in demand and any change which is along the same demand curve as a movement, will be termed as change in quantity demanded.
Substitute and Complimentary Goods
In today’s market no product is unique. For every product there are scores of other products which are similar. Demand is affected by changes in the pricing of such related goods as well. Substitute goods are those whose prices and quantities are directly proportional to each other. This means that the change in price of one will lead to a similar change in the quantity demanded of the other.
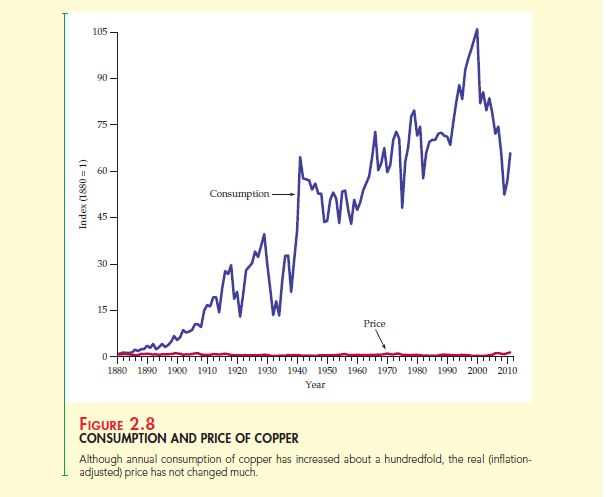
A good example of this can be that of the demand of beef and chicken. If the price of beef rises, you would consume less of beef and more of chicken as it is an option in the same category. An industrial example of this would be copper and aluminum. Because copper and aluminum are interchangeable, the price change of one will definitely affect the quantity demanded of the other.
Alternatively, Complimentary products are those which complement the purchase of each other. The price change in one product leads to an inverse change in the other. If there is an increase in price of one product then the quantity of other product will decrease. For e.g. in a hypothetical world if computers become expensive, then the demand for softwares will definitely diminish. Or if gasoline becomes dirt cheap, then there will be a scramble for the purchase of automobile cars.
In Figure 2, we have spoken about the shift of demand curve to the right because of an increase in Income. In the case of Substitute goods, the demand curve will shift to the right when the price increases for the substitute good thus spiking the demand for. Or else if a good is complementary then decrease in price would lead to an increase in quantity demanded. There can be many more variable factors which affect demand and can lead to the shifting of demand curve. A great example for this would be the demand of woolen wear during winters. There is a sharp increase in this product. However, the same demand is very low during the summer months. Hence, we can safely say that weather is also a variable in demand and supply.
2.2 The Market Mechanism
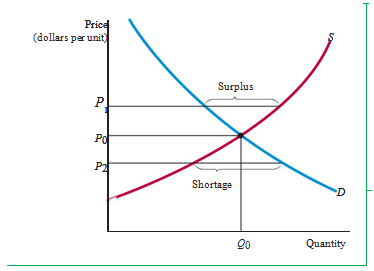
In Figure 3, you would notice that we have combined supply curve and demand curve together graphically. As represented in Figure 1 and Figure 2, the vertical axis here as well is the Price measured in dollars per unit. This is the price which consumers are ready to pay for purchasing a given quantity and the price at which suppliers are ready to sell a given quantity. The quantity demanded and supplied is represented by Q on the horizontal axis.
Equilibrium
The equilibrium point is where the two intersect in the graph (Figure 3). The price here is described as P0and the quantity is Q0wherein the quantity supplied and quantity demanded are just equal. This point is also referred to as Market clearing point. Market mechanism is referred to the proclivity of a free market to keep changing the price till the market clears. Even though, the tendency is for the market to clear; it is not the case always. The main cause of this is that demand and supply might not be in equilibrium because of a sudden change in conditions which might not allow the market to clear quickly. At the equilibrium there is no pressure on the price to change further as there is no excess demand or supply.
Markets tend to clear primarily because of surplus. Surplus is a situation in which the quantity which is produced and supplied is more than the quantity which is needed or demanded. This results in the producers lowering the price which further results in an increase in demand. Eventually the supply will decrease till the point where equilibrium is achieved. In Figure 3, if the price was above the equilibrium price of P0at P1, the consumers will demand less which would lead to the talked about surplus. The suppliers might also start producing more again leading to surplus.
The total opposite would occur as seen in Figure 3, if the price was at P2. The demand will be more and the supply less. This phenomenon is termed as a shortage. The shortage of a product at low price will lead to consumers rushing to purchase the product and out-bidding each other. This will lead to an increase in price which will eventually lead to the equilibrium point. It is to be noted that when price will increase, the suppliers will also start producing more.
When can Supply and Demand model be used?
The basic assumption while drawing up a demand or supply curve is that the given quantity which is produced or sold is affected even in a small way by the change in given price. For this to happen, a market needs to be roughly competitive. This basically means that sellers and buyers individually should have at least a little market power to affect the market price.
To better understand a competitive market we should take the example of a Monopoly. In a monopoly, a single producer controls the whole market. The monopolist can have an adverse impact on the demand and supply curve to suit his own gains, due to which the market will lose its individually dependent relation between price and quantity supplied. In a monopoly the monopolist might keep the price fixed and change the quantity or vice versa. The shifting of demand curve might present an opportunity to the monopolist where he might manipulate the quantity supplied or price. Hence, while working with the concept of demand and supply we always assume that the market is competitive.
2.3 Changes in Market Equilibrium
In the previous lessons, we have understood the impact various variables have on the demand and supply curve. These variables could be anything from capital costs, labor or income. We have also learnt about market mechanism and how it results in attaining the equilibrium point wherein the quantity which is demanded is matched by the quantity which is supplied at a given price. Now, let us study the impact which shifting of the demand or supply curve has on this equilibrium point.
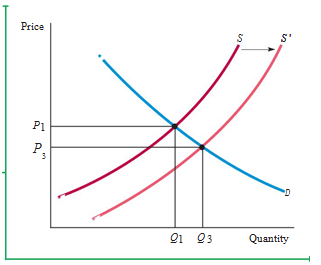
Let us begin by understanding a shift of the supply curve. In Figure 4,the supply curve has taken a rightward shift from S to S’. This could be because of a decrease in the price of raw materials. You would note that this shifting has led to a drop in market price from earlier P1 to P3. It has also led to an increase in the quantity supplied to Q3. From this we can gather that lower costs have always resulted in an increase in quantity produced. This leads to lower price and increased sales. This is one the major driving forces behind economic growth. With the advent of technological progress there is a massive decrease in production costs resulting to increased sales and decreased prices.
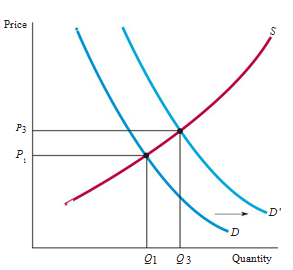
Figure 5 represents a rightward shift in the demand curve. This could be because of an increase in income. The consumers tend to pay a higher price P3 and firms tend to supply more quantity at the new equilibrium point in the new demand curve D’. The equilibrium point is achieved only when the demand curve comes in contact with the supply curve.
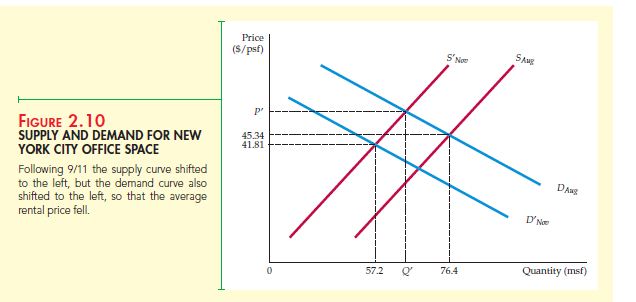
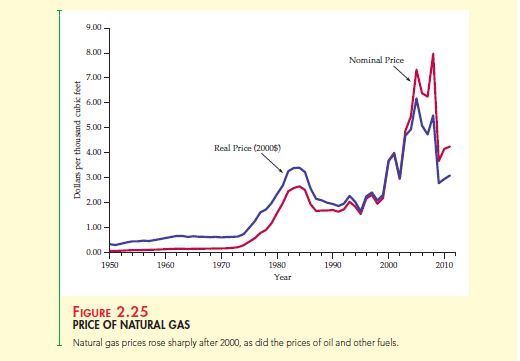
The demand and supply curve are constantly changing in most markets. The demand curve is usually impacted by the increase or decrease in income. The demand curve also fluctuates as per the seasons. For e.g. the demand curve will take a rightward shift for umbrellas in monsoons. It is also seen changing with prices of related goods. An example of this is the increase in demand for natural gas when the price of oil increases. Demand curve is also known to be affected by changing tastes. The supply curve is known to shift by change in capital costs, price of raw materials, wage rates and similar things.
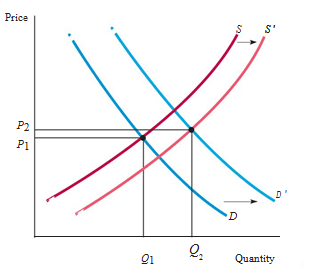
Demand and Supply curves are very useful in understanding the effects of such changes. However, to trace these changes on needs to understand in depth the characteristic dependence which supply and demand has on price and other variables. The price and quantity will always be dependent on the shape and shifts of the demand and supply curve. In Figure 6 itself, a rightward shift in the demand and supply curve leads to an increase in Price and an increase in Quantity. This proves the fact that any change in the curves will definitely lead to a change in the Price or Quantity and in some cases, both.
2.4 Elasticity of Supply and Demand
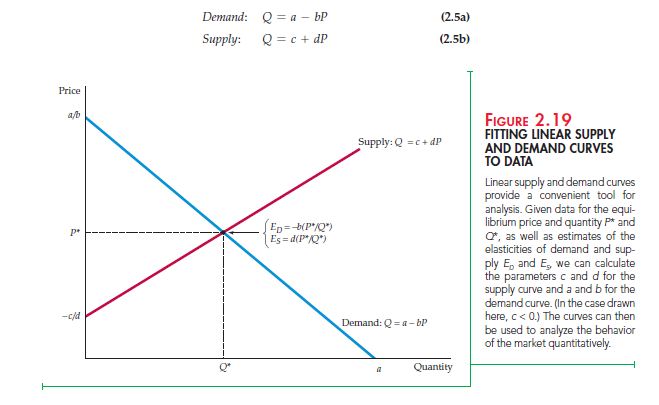
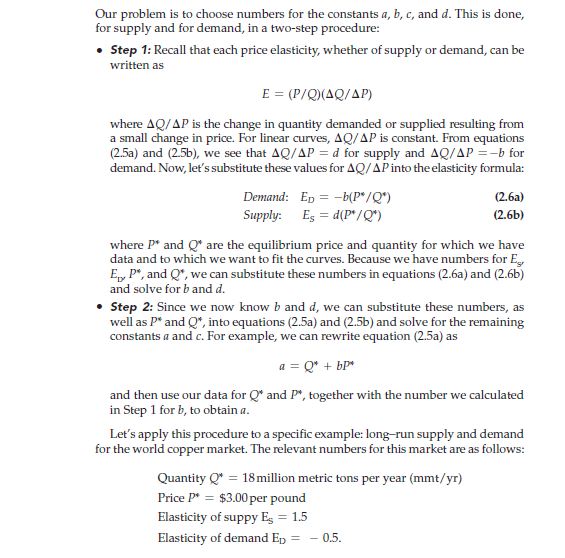
Elasticity is a factor used to determine the exact amount of the change in quantity demanded or supplied. It can also help with the individual sensitivities of demand and supply to other factors such as price, income, raw material cost etc. If the price of coffee increases, its supply increases and demand decreases. However, the proportion of quantity change is not clear. To understand such factors, elasticity is used.
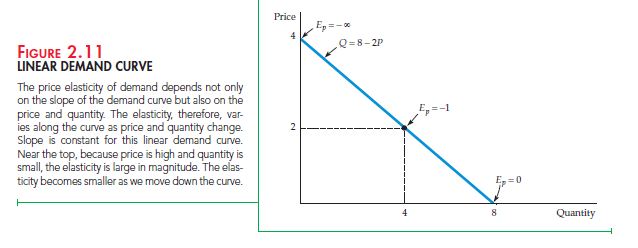
Elasticity can be defined as the impact that 1 percentage increase of one variable has on the other. This is how the sensitivity of one variable to another is derived. An example of this is that the change in quantity demanded to fluctuations of price can be determined by price elasticity of demand. The elasticity will let us know the exact percentage change in the quantity demanded for every 1% change in the price of product.
This is mentioned as EP and can be formulated as below:
EP= (%∆Q)/(%∆P)
%∆Q represents the “percentage change in quantity demanded” and %∆P represents the “percentage change in price”.
∆is basically a Greek symbol which is pronounced as ‘Delta’ and represents the change in a variable. For e.g. ∆X means a change in variable X maybe from previous year to the current.
The % change in any variable can be derived by dividing the variable by original level of it. It is also termed as the absolute change in variable.
As an example we can understand Consumer Price Index. If it was 200 at the start of a year and increased to 204 at the end of the same year, then the percentage change would be 4/200*100 which is 0.02 or 2%. This can also be termed as an annual rate of inflation. By this example we can safely derive another formula for price elasticity of demand: –
EP = ∆Q/Q P∆Q
———– —–
∆P/P Q∆P
The quantity demanded usually falls on increase of the price of a given product. This is the reason for negativity of price elasticity of demand. The Price Elasticity is also referred to as magnitude which means the absolute size.
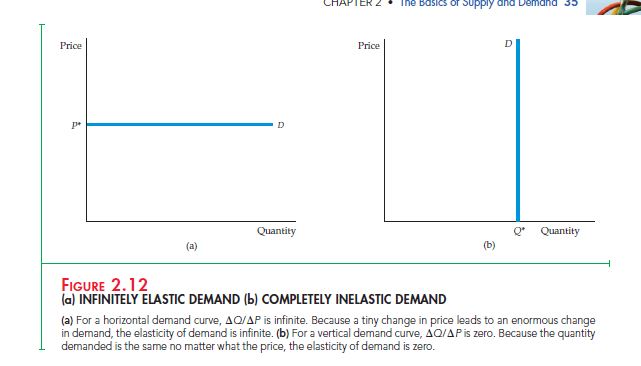
An important factor affecting the price elasticity of demand is the availability of substitutes for the product. If the substitute is readily available and if the price of a product increases then it will definitely lead to a decrease in the quantity demanded of the given product and increase in the quantity demanded for the substitute. This will lead to a demand which is highly elastic. Such a magnitude will be greater than 1 and the demand will be termed as price elastic. In the same vein, if the substitutes are not readily available, then even with a change in price, the quantity demanded for that product will not be affected upto a limit. This will lead to a demand which is price inelastic with a magnitude less than 1.
Elasticity of supply
The percentage change which a 1 percent increase in price has on the quantity supplied is termed as the price elasticity of supply. You would notice that this is generally positive as suppliers tend to supply more when the price of a product increases. This basically means that there is a positive relationship between the changes in price over quantity demanded.
However, price elasticity of supply is also affected by other variable factors. If the cost of raw material increases, then the quantity of goods supplied will definitely decrease. This is because the cost of input is increasing, with other things remaining the same, puts pressure on the supplier’s ability to produce. Other factors affecting price elasticity of supply are wage rates, interest rates, cost of raw materials, cost of intermediaries etc.
Point vs. Arc Elasticity
Point Elasticity is the elasticity at a particular point along the demand curve or supply curve. Till now we have only discussed these in both demand and supply. Point Elasticity can be defined as the price elasticity at a given point along the curve. It is dependent on the point of measurement of the curve.
However, many times we need to calculate the price elasticity over a portion and not just some point on the demand curve or supply curve. Let us try understanding with the help of an example. A business is thinking of increasing the price per product by $2 where the original was $8 and already expects the quantity to fall by 2 units to 4 units. How will we calculate the price elasticity of demand? If we go by the old price, the price increase is by 25%, however, if we calculate by the new price the % change is 20. The same can be seen by measuring quantity demanded. By the old quantity the quantity demanded decreases by 33 1/3% however, by the calculating as per new unit, the decrease is almost by 50%.
Under Point elasticity method there does not seem to be any correct answer. If we calculate as per the new expected figures, the price elasticity of demand comes to -2.5. However, if we use the original numbers the price elasticity of demand falls to -1.33. We can note that the difference between both magnitudes is too large to let either one be of much use. This is where Arc Elasticity of Demand comes in.
By calculating using an average of both prices and quantity we can achieve a cohesive elasticity magnitude. The arc elasticity of demand is extremely useful when calculating over a range of prices rather than a given fixed point. The arc elasticity can be formulated as below: –
Arc Elasticity: EP= (∆Q∆P)(/)
Using the same example the Arc Elasticity will be (-2/$2)($9/5) = -1.8
Even though arc elasticity is a very useful concept, economists by default refer to Point elasticity whenever referring to elasticity unless otherwise stated.
2.5 Short run vs. Long run elasticity
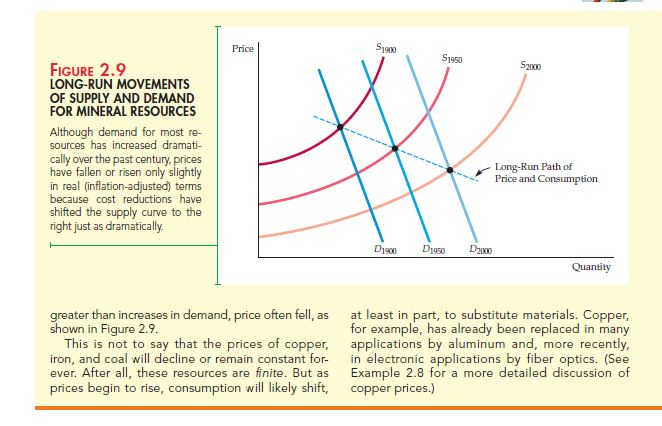
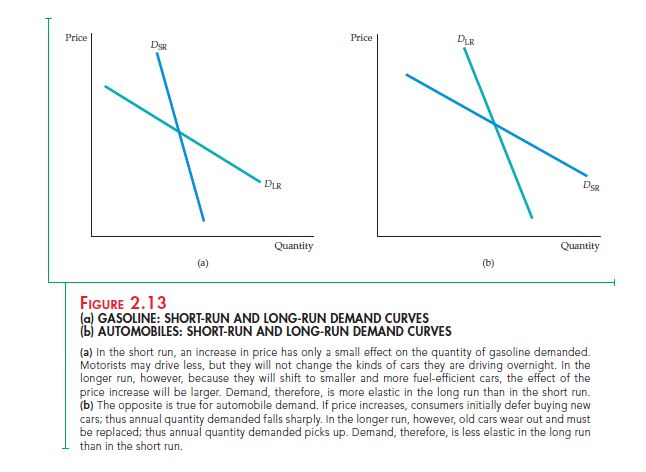
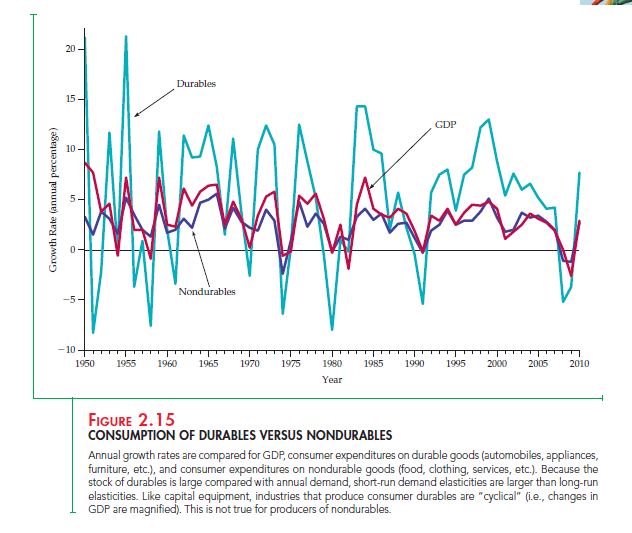
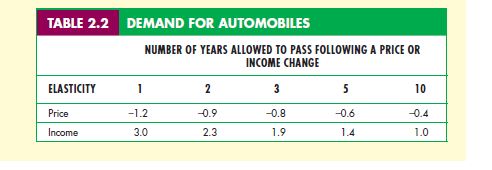
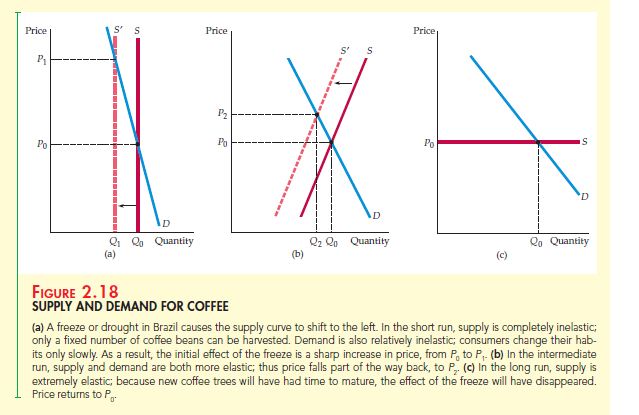
In analyzing the change of quantity demanded with that of the change in price, we need to understand the time frame that has been allowed to pass. A short run is a time frame up till a year and a long run is anything above that. Long run basically means that consumers have been given time to fully accustom to the price fluctuations. The curves of demand and supply in the short run look very different from the curves of demand and supply in the long run. This is a very important factor when observing the demand and supply of any commodity.
Demand
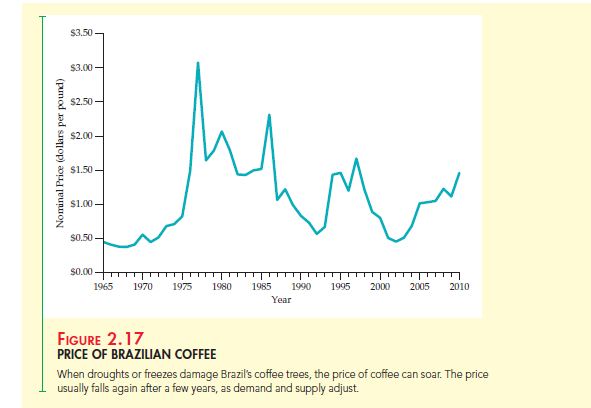
The demand of many products is more elastic in the long run rather than short run. A basic example of this is the consumption of coffee. Even if there is an immediate hike in the price of coffee, the demand will remain the same in the short run leading to no change in the quantity supplied. This is because it will take people time to let go of their coffee drinking habit.
In the same vein, the demand for a good might be dependent on the availability of another. For e.g. the demand for gasoline becomes more elastic as we shift from short run to long run. This is because even when gasoline becomes dearer, people cannot stop using it. However, with the passing of time smaller and fuel efficient automobiles might hit the market leading to less demand.
Supply
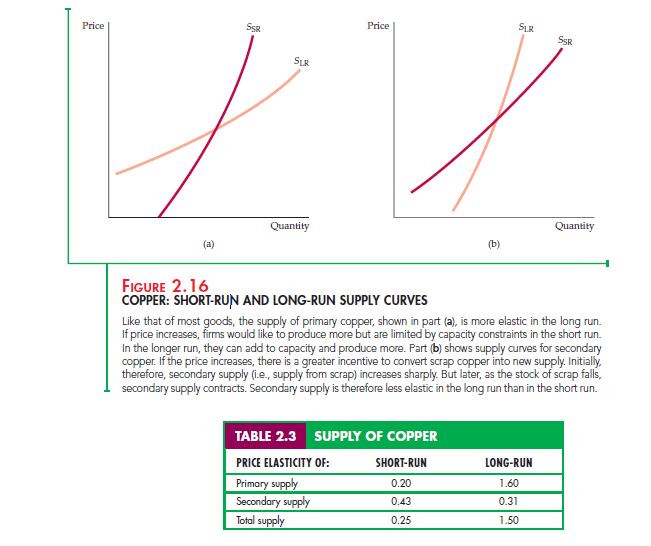
In the same way elasticity of supply is also dependent on time frame. The elasticity of supply tends to be more elastic in the long run as compared to the short run. This is primarily because a firm cannot increase capacity over-night. Firms mainly suffer from capacity constraints in the form of building of new production units, hiring of more staff etc. However, many firms tend to overcome this by fully utilizing the existing resources. With a sharp hike in price, a firm might ask workers to work overtime and use the facilities for more hours thus increasing the quantity supplied. They might also hire new workers immediately. However, the output will expand more after some time has passed and when firms hire a large permanent workforce to work in the new plants.
Many firms can increase the output supplied in the long run if the price incentive is good. However, many don’t opt for such practices as it can prove to be costly and inefficient. However, this does not mean that firms do not rely on this practice.
Some goods and services experience a completely inelastic environment in the short run. The best example of this is the study of rental. The number of rental units is fixed is any given area. Even with an increase in rental cost in the short run, the demand does not diminish as people are not left with a choice. This only aids in pushing the price up. As time passes the high rent attracts the construction of new units or renovate the existing ones. This result in an increase in quantity supplied.
2.6 Understanding and predicting the effects of Changing Market Conditions
Till now we have mainly spoken at length about the qualitative changes of demand and supply. However, to analyze and predict the effects of changing market conditions by use of demand and supply we need to focus on the quantitative aspect. This can be achieved by studying actual demand and supply curves and then observing the changes in price resultant of a shift in these curves. For e.g. if we need to determine the change in world price of coffee by a 50% reduction in supply of Brazilian coffee then we must start analyzing the numbers associated with it on the demand and supply curve.
2.7 Effects of Government intervention – Price controls
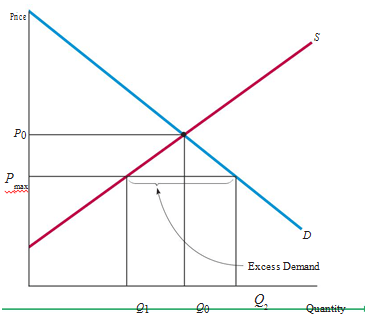
In any market, may it be of United States or any other industrial country, the government always intervenes. They might impose taxes, grant subsidies or simply regulate the markets as they deem fit. Government can even intervene in a competitive market. A common form of government intervention is by way of placing controls on price. This has its adverse impact on the demand and supply of that product.
In Figure 7, you can see that P0and Q0 are the price and quantity respectively at the equilibrium point. This is the price and quantity which is prevalent without any intervention by the government. When the government puts a capping on the maximum price the result is of excess demand. PMAX is the ceiling price which the government has fixed for this particular product which is lower than the equilibrium price of P0. However, suppliers are not ready to supply the equilibrium quantity demanded at the same cost. They decrease their quantity supplied to Q1. With the decrease in price, more consumers enter the market to purchase and the existing consumers also demand more. Q2 is the new demand which results in a shortage as the demand exceeds the supply.
Summary
- The analysis of supply and demand is an important leg of micro-economics. In a competitive market the quantity demanded by consumers and quantity produced by firms can be judged by studying the supply and demand curves as a function of price.
- The tendency of demand and supply to move to a price which is at market clearing level is termed as market mechanism. This result in price equilibrium which equates the quantity demanded to the quantity supplied so that there is no excess of demand or supply.
- The sensitivity of demand and supply to a proportionate change in price, income, and such variables is termed as Elasticity. They are of two types; point elasticity and arc elasticity.
- The time frame is an important factor while analyzing elasticity as short run tends to be very different from long run.
Questions for review
- Why will the price of ice cream rise to a new market clearing level when unusually hot weather shifts the demand curve for ice cream to the right?
- With the help of demand and supply curve explain how the price and quantity of butter both bought and sold will be affected by the following events:
- Price of margarine increases
- Price of milk increases
- The average income level decreases
- Calculate the elasticity of demand when a 3% increase in price of corn flakes results a 6% decrease in its quantity demanded.
- What is a shift in the supply curve and movement along the supply curve? Explain its difference.
- Why is short run elasticity of supply shorter than long run elasticity for many goods?
- Explain the difference between long run and short run price elasticity. In the case of paper towels and televisions explain
- Which is more durable?
- Will the price elasticity of paper towel be larger in short run or long run? Why?
- Price elasticity of demand for television in long run vs. short run.
- Explain if following are true or false: –
- Slope of a demand curve is the same as elasticity of demand
- Cross price elasticity will always be positive
- Supply of apartments is more elastic in the long run than the short run
- Explain why there will be a shortage when the government regulates the price of beef and chicken to set them below their market clearing level. Also explain the effects on the price of pork briefly.
- If a city council sets the rental limit to $700 per month when the average annual market clearing rent was $700 per month and the same was expected to rise to $900 for a two bedroom apartment explain: –
- effects on rental price of an apartment with the help of supply and demand graph
- whether the policy will benefit all students
- While discussing tuition rates, an official terms the demand for admission as price inelastic. To prove this point she states that though tuition has been doubled (in real terms) over the past 15 years, there has not been a decrease in the student applications. Explain whether you accept this argument. (Hint: Do you think the official has observed the demand curve even though she is making an assertion?)
- P is the price for a product and Ps is the price of its substitute at $2. The demand curve is
Q = 10 – 2P+PS
- What is the price and cross price elasticity of demand when P is $1.
- What is the price and cross price elasticity of demand when P is increased to $2.
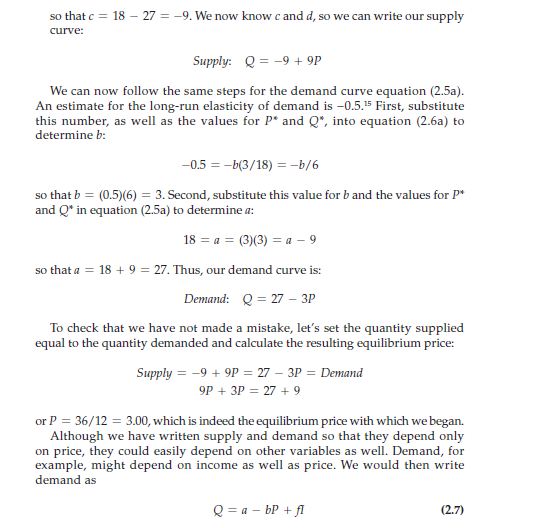
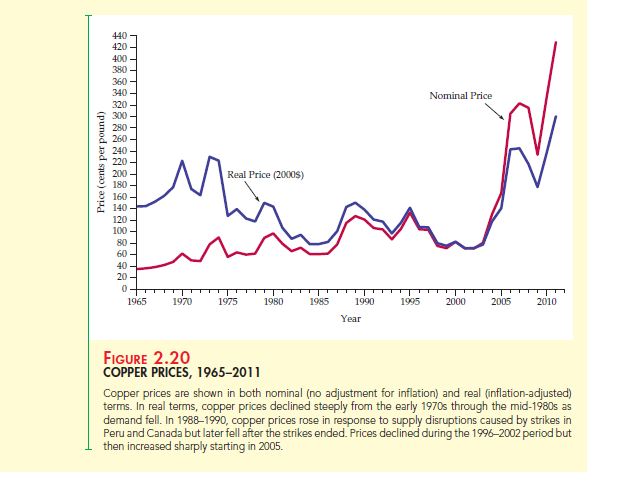
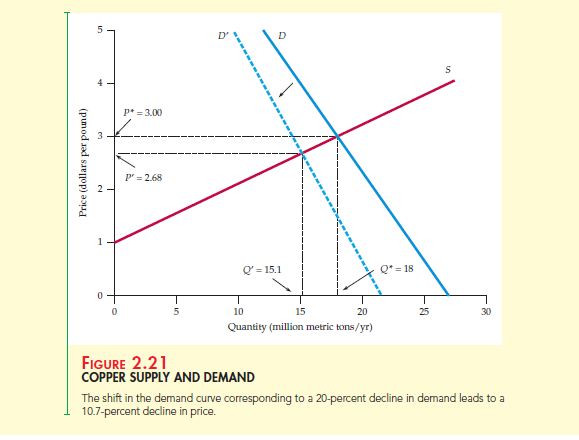
- How will the price of copper change when a decrease in cost of copper production causes a rightward shift in the supply curve by 40%
- Would there be any effect of price control on demand for natural gas if the demand is perfectly inelastic?
Exercises
- If demand curve is Q = 300 – 2P + 4I where I is the average income measured in thousands of dollars and supply curve is Q = 3P – 50, then find the market clearing price and quantity when I = 25 and I = 50. Also draw a graph illustrating the answers.
| Price (Dollars) | Demand (millions) | Supply (Millions) |
| 60 | 22 | 14 |
| 80 | 20 | 16 |
| 100 | 18 | 18 |
| 120 | 16 | 20 |
- Calculate price elasticity of demand with price at 80 and 100
- Calculate price elasticity of supply with price at 80 and 100
- Calculate equilibrium price and quantity
- If the ceiling is at $80 fixed by government. Will it lead to a shortage and by how much?
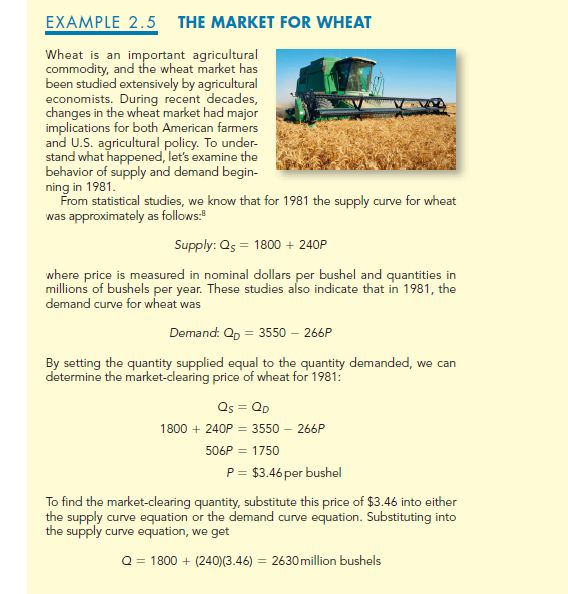
- If the total demand is Q = 324 – 283P and supply is Qs = 1944 + 207P and if 200 million bushels is added to the demand, what will be the free market price and at what quantity will the wheat be produced and sold.
- From the below given table answer the following: –
- Equation of demand and supply
- Price Elasticity of demand at a price of $9 and $ 12
- Price Elasticity of supply at a price of $9 and $ 12
- Price and level of fiber imports in a free market
| Price | Demand (millions lbs) | Supply (Millions lbs) |
| 3 | 34 | 2 |
| 6 | 28 | 4 |
| 9 | 22 | 6 |
| 12 | 16 | 8 |
| 15 | 10 | 10 |
| 18 | 4 | 12 |
- In 1988, if the total demand for wheat was Q = 3244 – 283 P with domestic demand being QD = 1700 – 107P and domestic supply as QS = 1944 + 207P, and if the export for demand falls by 40% then answer the following keeping in mind that much of demand for U.S. agricultural produce comes from other countries.
- Effect on free market price of wheat in U.S because of fall in demand. Do farmers have a reason to worry?
- If the government want to raise the price to $3.50 per bushel, how much wheat would it have to buy and at what cost?
- The demand is determined at QD = 160 – 8P by rent control agency of New York City and supply has been estimated at Qs = 70 + 7P by board of realtors. Answer the following: –
- What is the free market price and what is the change in city population when the maximum average monthly rent is $300 and all those who cannot afford leave
- How many apartments are constructed when 50% of long run increases come from new constructions after the rent is fixed at $900 per month.
- In 2010, the numbers of cigarettes smoked were 315 billion in 15.75 billion packs. The average retail price was $5 with price elasticity of demand and supply at -0.4 and 0.5 respectively. Answer the following: –
- Draw linear demand and supply curves for the market
- If the retail price was $2 with a consumption of 23.5 billion packs in 1998, what can you say about the price elasticity of demand when the decline in consumption is entirely due to increase in price
Link of Previous Main Topic:-
Links of Next Microeconomics Topics:-
- The Basics of Supply And Demand
- Consumer Behavior
- Appendix to Chapter 4 Demand Theory a Mathematical Treatment
- Uncertainty and Consumer Behavior
- Production
- The Cost of Production
- Production and Cost Theory A Mathematical Treatment
- Cost in the Long Run
- The Cost of Production Production with Two Outputs
- Profit Maximization and Competitive Supply
- The Analysis of Competitive Markets
- Market Power Monopoly and Monopsony
- Monopolistic Competition and Oligopoly
- Game Theory and Competitive Strategy
