Earlier we have discussed ‘production of labor and capital’ by keeping capital as fixed and labor as variable. In this potion the readers will beget to know about two different variable inputs (labor and capital) and its effect on the production. We analyze the changes in the output of the firm because of this new input combination for the production process.
Isoquants
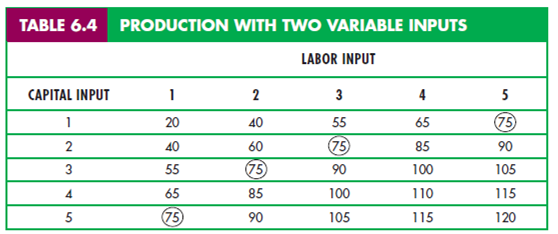
Consider two inputs for the production of certain output say food. A table will be constructed taking labor inputs in each row and capital inputs in column as shown below-
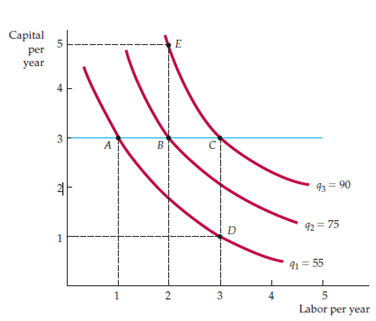
Each entry shows the output which can be achieved every year. After converting the data into graph format, we get an isoquant map which shows the way of representing the amount of output for a particular given amount of input as shown in figure below-
Note:
The above Fig. 6.5 shows isoquants map produced by the combination of given inputs using the Table 6.4.This figure shows the output of both can be increased when we move upwards. Moreover, the right side of the figure also shows increase in the output.
Input Flexibility
Isoquants give complete flexibility of choosing the desired input to get the output as per the requirement. It helps manager to make a decision how to substitute the input for specific output so that the firm can achieve the target at the end of the year without losing its capital.
For example, you might have noticed changes in the fast-food restaurants by looking at recruited older aged people. And with the self-service programs, the shortage of young and low-wage employees can be sorted out without misleading the way of providing food.
Diminishing Marginal Returns
Though the organization is working with two variables, the input should be well-balanced or optimized to get the output as per the change in input.
Using the above figure, we can get the diminishing marginal returns by drawing a straight horizontal line at particular capital input. Horizontal blue line at 3 shows the diminishing marginal returns. We can even see that when labor is increased, the output increases by considerable amount but it becomes diminishing when we continue increase an additional unit in the long run as well as short.
It specifies that when labor or work force is enlarged keeping the capital constant, the isoquant turns down to adulate. Similar will be the case of capital input. It means when capital is increased keeping the labor constant, the isoquant becomes steeper.
Substitution among Inputs
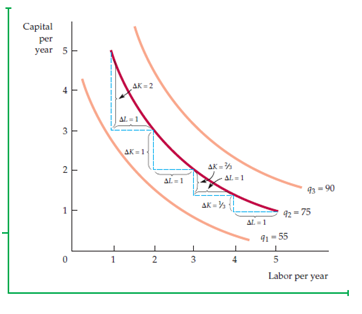
As two inputs are variables, the manager can consider the substitution of one input with another to manage the price flow, keeping output constant. Checking the slope of isoquants tell the story how one quantity is substituted with another one.
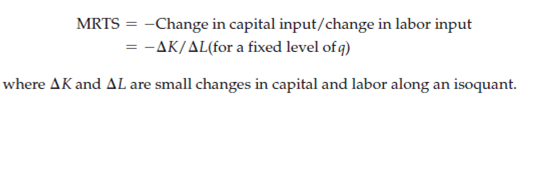
Here, MRTS (Marginal Rate of Technical Substitution) will be a factor of concern where one additional unit of work force is considered to be substituted for the same level of capital.
Mathematically,
Fig. 6.6- Marginal Rate of Technical Substitution
Production Functions – Two Special Cases
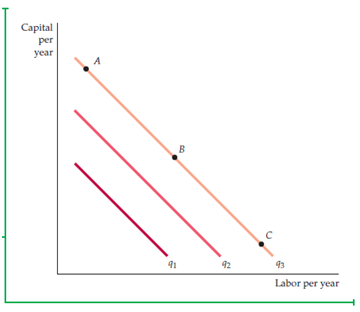
In first case, the inputs ‘labor and capital’ show the perfect substitution for one another as shown in Fig. 6.7-
Note:
The above figure shows three straight lines of isoquants which specify the rate of return or output is same.
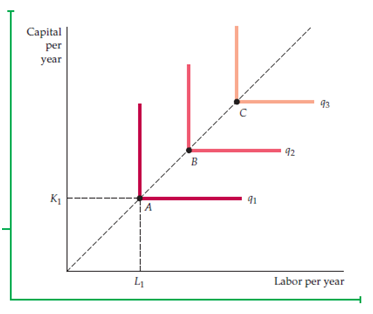
In second case, the Leontief Production Function comes into act because of opposite condition (imperfect combination) as shown in Fig. 6.8-
Note:
The above figure shows three L-shaped isoquants which specify the indifference in production. So, it is not acceptable in any business organization.
6.4 Returns to Scale
The above analysis shows how the changes in input variables could affect the output or keeping the output same. In case, the manager is willing to increase the output of the firm. Then, to get the production in proportion with the input, we consider three cases-
- Increase Returns to Scale
With the prospect to increase the output to its double figure or more than that, increase get back to scale is considered. It can be seen in large organization where numbers of workers work together. For example, assembly line in automobile industry.
- Constant Returns to Scale
When managers think to increase the inputs up to double to get doubled output, it is specified as constant returns to scale. For example, serviceability (capital plus client) of a travel large agency will be similar to serviceability (capital plus client) of a small agency.
- Decrease Returns to Scale
Sometimes it happens that doubling of inputs might not result in doubled output, it comes in decrease returns to scale. It might be the reason of interpersonal relationship between managers and workers that hamper the result.
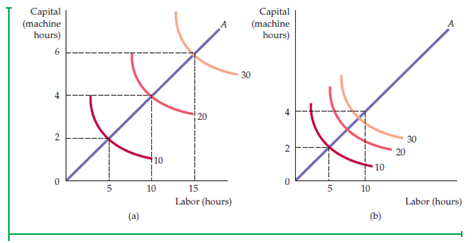
Fig. 6.10 shows Returns to Scale
- Isoquants remain equally spaced when output increases proportionally
- Isoquants get closer when inputs are dissimilar along the inclined line
Describing Returns to Scale
Returns to scale differ in different organization and as per the extent of the organization. Smaller firm has greater potential to get increased returns to scale while bigger firm has potential to get constant or decreased returns to scale.
This is because the large scale industry requires greater capital and energy to operate while small scale industry requires less capital and energy. So, the output amount (in terms of percentage of input and output) can be efficiently figured out.
Links of Previous Main Topic:-
- Introduction Markets and Prices Preliminaries
- The Basics of Supply And Demand
- Consumer Behavior
- Appendix to Chapter 4 Demand Theory a Mathematical Treatment
- Uncertainty and Consumer Behavior
Links of Next Microeconomics Topics:-
- The Cost of Production
- Production and Cost Theory A Mathematical Treatment
- Cost in the Long Run
- The Cost of Production Production with Two Outputs
- Profit Maximization and Competitive Supply
- The Analysis of Competitive Markets
- Market Power Monopoly and Monopsony
- Monopolistic Competition and Oligopoly
- Game Theory and Competitive Strategy
