Now let us dig into the fact that regarding debt and equity what kind of evolution the ratios faced? Let us start with Metaphysics. These natures can be examined at various levels of the relationship between cause and effect. Of course you can do a deep analysis. Once you go deeper into the subject you will understand that gradually you are moving inside the sphere where there is philosophy and also theology.
Now taking an example:
What if you want thorough knowledge about a car’s speed? You will first encounter facts like:
- Low weight
- Low resistance during cutting through wind. It cuts sharp
- Too much Power
Now you may want to know the reason behind such high power. Once you start counter questioning it will only take you deeper into the cause and effect relationship. Then regarding cars you may have questions like:
- Number of cylinder the engine contains
- Intake valves the car’s engine contains
The again the question may arise:
- Why this engine does has that many cylinders and valves?
- Why is it needed to make the engine more powerful?
- Facts around gasoline combusts
And if this goes on for long, you can also have questions like:
Things on nature’s physical behavior
Questions on theology
But when you start gathering so many information you tend to forget the actual phenomenon that may be the specific fact involve around the broader concept. Now when you consider the car’s speed it means you should start simplifying the models you choose for you analysis.
Now going back to our actual discussion. The motto of all this was to make you understand that when you consider such questions, it may also come up during analysis of capital structure in corporate firms.
Let’s try and analyze the factors around ratio changes of debt and equity on two different levels.
Firstly, let’s consider a small-scale factor “mechanistic layer”. This helps you to find out the importance of variables in mechanisms along whose line the ratios of equity and debt evolves. However you can see that mechanisms like the one we talk of here are already illustrated in Table 21.1.
- Debt & equity repurchasing
- Equity & debt issuing
Secondly, now we go into a casual layer that will move on to illustrate:
- Variables
- Economic Forces
- Characteristics
These factors drive the companies and markets related to finance to involve these mechanisms.
However the examples and explanations of car mechanisms will definitely vary when you are analyzing capital structure.
But there remains a single fact that you can consider or categorize in both the levels. That is the role played by the changes in a firm’s stock value. This change of values of stock can be considered as:
A mechanism that plays a major role in creating shifts in a firm’s capital structure
Also can be classified as a force dominated by economic factors, but it has a half-an-half behavior, that is its half portion lies inside the domain of factors or mechanisms and another part lies outside it
These mechanisms that we talk of frequently are used by accountants to bring changes into capital structure.
22.3 A Mechanisms: How Does Capital Structure Change Come About?
Why not start with the larger fishes mechanisms. When we talk of the real life firms, did you ever think that what exactly the advantage of learning different types of mechanisms used throughout the chapter you read previously? Think about it. Didn’t it occur to you as in what derives a firm’s ratios of debt and equity? Is it generally the company’s value or is it manipulated by the CEO whose activities under issuing the net amount plays a major role? This net factor typically includes:
- Issuing
- Dividends
- Repurchasing
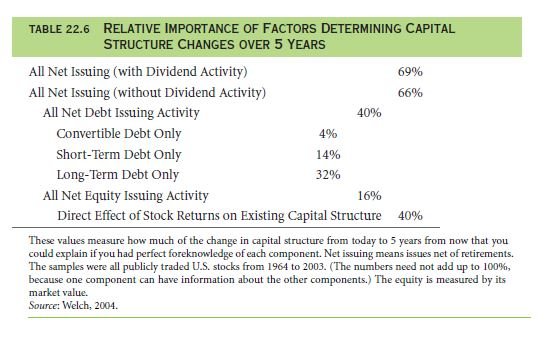
However, you can also take it the other way round. How about a prior knowledge that you could have obtained? What if you already knew the function of the firm in issuing in the coming future years, then how well would you have elaborated about the minute changes in a company’s capital structure? Not to worry we will show you a way. Study the Table 22.6 which has got an explanation to your query taking into account five year long horizons.
Net Debt and Equity Issuing Activity
When you look into the first utmost row in Table 22.6, it will clearly show you that every CFO of these firms plays a major role in shaping capital markets. If you only had the data of the ways firms issues debt & equity under retired section; also the amount of paid in & also sum of paid out, the it would have been easier for you to elaborate on the fact that 69% of a company’s sum of capital structure goes through a change with the period of five year horizon.
The left out 31% fell under the category of changes happening in the corporate value didn’t have a direct influence from the top management authorities that manipulated issue & repurchase.
Thus when you are completely deleting the dividend section you explanation rating dropped from 69% → 66%. Therefore it clearly shows that when you use dividends it basically shows a mere shift of 3% change in a company’s captal structure. Now when you consider comparing the dynamics associated with the ratios of debt and equity when laying it down on a chart dividends do not play much role in publicly traded firms.
Issue of net debt:
Now study 3rd row explained in Table 22.6. It will show you that there is a change in 40% of all firm’s capital structure of all kind when showcased through a duration of five years, and this happens because of a company’s activity of issuing of net debt.
Now let’s see what the next 3 table rows say about ratio changes of debt & equity:
Debt issued over long-term period → makes a change of 32%
Debt issued over short-term period → contributes less in the change
Convertible debt → not playing any major role
Now break the activities of issuing of debt
This gives you a clear picture of exactly which mechanism is playing a role in deriving the firm’s structure of capital. However, even analyzing and researching in this field for year, no one exactly shows you this structure. But it definitely gives you a better understanding.
Issuing of net equity:
Now take a look on the Table 22.6‘s 7th row. It will tell you that Issuing of net equity clearly elaborates a 16% of change brought in a company’s ratios of issue of debt & equity. Thus proving a lesser figure, it shows that it plays a much great role than issuing of net debt while determining the structure of capital.
As this study of ratios of equity as quiet interesting things, experts an economists goes on to dissect and analyze it deeper.
Table 22.7 will further break down the issuing of equity into many of its other components. However it will do it only for the bigger fishes. This is because information about the smaller companies are lesser than the information about the larger firms. This table will successfully show that not all shares come from plain seasoned of offerings from equity. Rather if you take a close look from the year 1999 – 2001 you will find that these shares of equity came from offerings of equity that was done by corporate acquisitions. However this does not show the companies ratios of debt and equity going through a decline when acquisitions were being considered. Thus a company issues:
- Acquisitions from debt → finance
- Shows that the ratios of leverage are generally nonlinear
These patterns are also true when we look into the case of IBM.
Let’s take a look in section 15.4 where:
↓
IBM didn’t go on for issuing the equity
↓
Rather repurchased shares that went into their treasury
↓
Thus these shares of equity from their treasury were used during acquisition of their PWCC partners
↓
Also used these in funding their employee stock which was an option plan
Also, when you look into few other papers it will also shows that when you are including mergers & acquisitions activities, offering from public equity is not common. Further you will notice that 10,000 or more companies that are trading in the NewYork Stock exchange and also the American stock exchange i.e., NASDAQ stock market during 1990 – 2000 only conducted equity offerings of about 12,000. However among this 50% came from public offerings whereas another 50% came from offerings of seasoned equity. If you look closely then you will understand that these publicly traded companies issues the equity only once in twenty years.
Firm Value Changes and Stock Returns
Now when you move on to the last row of Table 22.6 it will show you that what is the direct effect that capital structure in having from stock returns. Do you remember that this change is basically in ratios of debt and equity experience by a firm? This of course happens when the firm’s equity ratio values increases or even sometimes decreases.
You already know that you can view corporate returns in stock as mechanism and also external force as well. These two things basically cling and manipulate the ratios of a company’s debt and equity.
Now moving on to Table 22.6, it will show again that information around stock returns of five years horizon had been available with you; you can explain easily the 40% change in a company’s sum of capital structure.
I know this is not new to you that return from stock play an important role. You had earlier seen in Section 15.4, that these changes in IBM’s stock prices, was the reason behind reducing its value of equity by 1/3 between 2001 and 2002. Thus these stock price changes became the actual cause for increasing IBM’s ratios of debt and equity making 0.31→0.55
However accountants didn’t have a manipulation tendency in these returns from stocks. Thus from these proven facts you can concluded that even in a five year duration companies are not exactly rebalancing completely the structure of their capital. However it can occur to you that whether these accountants are manipulating or not from the 40%. However not all evidences state that.
This is because when the stock price is increasing the company will answer to that by issuing equity and debt similarly.In this case companies often pay more amounts of dividends. Thus these effects from timing in the ratios are true. Therefore this 40% that is being shown is coming from the direct effect on value of returns from stock on the ratios of debt and equity. You may sometimes want to understand a fact that why there are companies having a high ratio of debt and equity nowadays while there are some firms having low ratios. You must then explain that the firms having high ratios at some point had an experience of negative returns from stocks and sidewise the firms having lower ratios had an experience of positive returns from stock.
Accountants also do not play a role in paying out a larger amount of gains in terms of values or does not even raise another large sum of funds just to respond to larger loss in values. There is also another fact. Consider the firms which have a bigger position, it never started that big primarily for they were responsible for raising more funds. They became big because they clearly appreciated when the talk of value came. Sometimes companies also knowingly choses first the target scale + target of ratios of debt and equity, and then they goes on to retain their fixed targets. Thus this relationship that the returns from stock and structure of capital have with each other clearly depicts what the future life cycle of natural ratios of debt and equity for a company will be.
When slowly the company is surviving by gathering equity, it results in the increase of scale and side wise there is a decline in its ratios of liabilities and also ratios of debt. Evidences you can find in the Section of 22.2B
It shows that:
- There are many large firms that are non-financial often have ratios of debt at a very lower scale. Sometimes their ratios stand at single digits
- Thus when they are depending on a fixed measuring of ratios of debt they will definitely have a ratio that stands at 40%. Which is not exactly close to 0
However nowadays larger companies have higher ratios of debt. Therefore if you question that whether the big companies have a low ratio of debt, the answer will be no. But there is more. Another fact that comes up “survivorship bias”, that shows that an average of publicly traded companies in the U.S. were there for a duration of only five years and then it went onto becoming bankrupt. In this case those firms were bought by some other company and even in some cases they merged to become another new personality.
However even after considering the importance of some mechanisms that plays a major roles in bringing in the diversity factor in the structures of a company’s capital, is still unclear.
Digging Deeper
Return of stocks sometimes plays a proxy role for changes in value. And we have already talked about it in section 22.1 D. But a stock return often misses some changes that happen in asset values that have been underlined. Sometimes these changes have played advantageous or even sometimes hurt the holders of debt, because in this case they may come out of it by making a proper repayment of debt.
But if in any case the company is coming close to or even in financial distress, then company’s all own changes in value will go to the owners of equity.However in extreme cases the debt that is risk-free does not have an effect from the changes in values. Also you can see that the stock returns become equal to these changes in values. Though we won’t suggest that changes in stock values do not take place but they usually are in a small amount and that is why the proxy given to return of stocks tends to capture how companies act differently regarding changes of values. And since we didn’t have the information on good value of market for debt of corporate category, our measurement for the complete analysis of value changes remained unsuccessful.
Links of Previous Main Topic:-
Links of Next Financial Accounting Topics:-


