Though the publicly traded companies differ from one another, but you would like to go deeper when we talk of IBM
Many questions may arise in your head. Like what kind of a firm is it? How much the measuring system differs from firm to firm? What pattern they follow?
You would be happy to know that you can take different ways to measure the indebtedness
- Go for narrow or a broader approach:
Narrow category –debt incurred over a period of long-term + current liability debt
Broad category –non-financial obligations
- Calculate equity regarding market worth and book value.
- Also evaluate equity as the total estimated ratios:
Debt of equity
————————- = ratio of debt-to-equity
The value of equity
Total ratios
——————– = ratio of liabilities-to-assets (Here capital = debt + equity)
Bigger number
Try to keep the total of ratios from 0% to 100%
Now, for your convenient we would see into different methods and measuring ways in different time period. This way you can start applying the multidimensional variety of measuring ratios.
22.2 A THE LARGEST U.S. FIRMS IN 2005
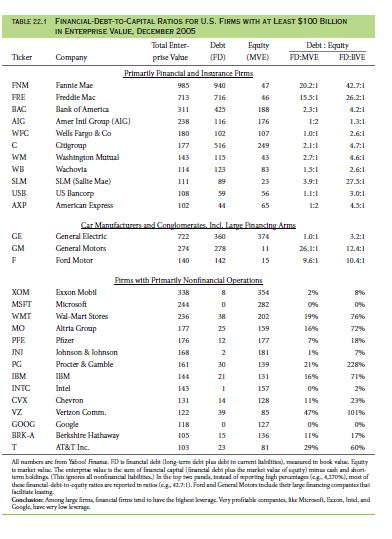
First let’s show you the comparison between 28 different publicly traded firms of the United States recorded from Yahoo! Finance. This shows the results obtained in the year ending of 2005.Table 22.1 showcases both variables of book&market worth.
Out of 28 publicly traded firms:
- 11 – businesses related to finance
- 1 – large conglomerate
- 2 – car manufacturers & financers
- 14 – Other businesses. (Ex: IBM.)
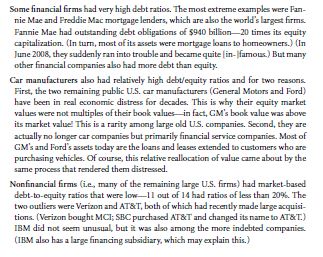
Much like IBM we can derive from the table that maximum large firms contained their market worth as 2× or 3× book value of the firms
Thus you can see the following result:
If you cannot classify large conglomerates such as general electric, why not go for easier debt ratio analysis.
Examples:
By taking into account 416 non-financial firms that has a market value of more than or equals to $10billion, you will have the below mentioned data:
Companies having substantial debt:
12 enterprises having debt ratios >90%
- 4 airlines companies
- American
- Delta
- Northwest
- United
- 3 car manufacturers
- Goodyear
- GM
- Ford
- 3 firms relating to energy
- Mirant
- Calpine
- CMS Energy
- 2 Charter Cable &Owens-Corning
They had also faced bankruptcy.They had gone through a decline in the previous two years
You can also take into account firms that are also highly indebted. Thus there emerges a pattern.
Among following 40 firms having ratios of highest debt:
- ¾ energy firms —they experienced loss in 2004. However they emerged as leading company in 2008
- ¼ firms related to car manufacturing
Another 191 firms dealing in finance had ratio of debt equals to 55%
Leading firms with very little, sometimes zero debt as well:
- Intuit
- Microsoft
- Other software manufacturing firms
- Some biotech companies (for example Bed Bath & Beyond)
22.2 B PUBLICLY TRADED U.S. FIRMS IN 2003
You may conclude that the big names mentioned in this chapter are not exactly representing firms from the economy of the United States. Smaller companies also contribute if not much but a portion of the economy. No person can individually evaluate these firms’ structure of capital. Therefore you need a quantitative method to deal with such large amount of information. If you have that information it will give you benefits like:
- It shows the similar patterns of the structure of capital as during 2003, 2004, & 2005
- Also in 2003the small firms under the category of publicly traded didn’t incur much loss
- Also shows, the great escape of the bigger fishes during recession period
- It showed that the large firms earned solid book of accounts
- You need to understand that all factors varies on a yearly basis.
- As we are talking of IBM, you can also compare the numbers in this chart with other firms on a yearly basis.
- It is always up to you how you analyze the data of different companies.
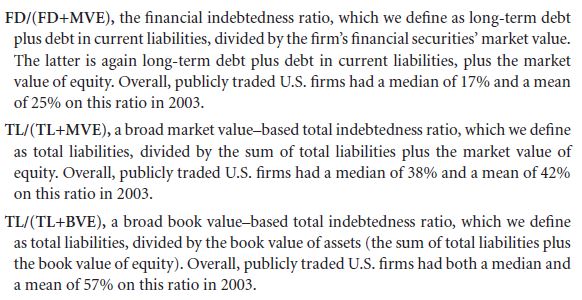
Let us consider three different measures:
When you are referring to IBM the degree of defining indebtedness will always matter considering the numbers you are getting and how much it varies. Remember one thing, the debt ratios based on finance and also market will be lower than any liability which is broader in sense and also the ratios based on book value.
You only face problems during comparison between companies belonging to the same category of firms and are also having a similar range of leverage ratio. Because no matter what measure you take they will always come up in the similar rank.
INDEBTEDNESS RATIOS
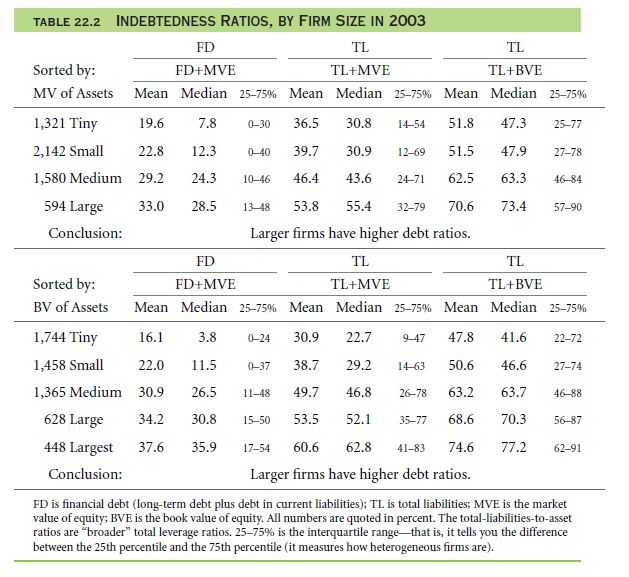
Table 22.2 is determined by the size of the firms. Companies had market capitalizations:
- Tiny firms – <$100 million
- Small firms – $100 million to $1 billion
- Medium firms – $1 billion to $10 billion
- Large firms – > $10 billion
Equivalent categories of book value:
- Tiny firms – $100 million
- Small firms – $500 million
- Medium firms – $2.5 billion
- Large firms – $10 billion
Thus we can derive that the larger firms will always have more indebtedness irrespective of
- How the categorization is sorted
- The chosen ratio of indebtedness
- Using median or mean process
You will also notice variations among the firms categorized.
PROFITABLE AND UNPROFITABLE FIRMS IN 2003: INDEBTEDNESS RATIOS
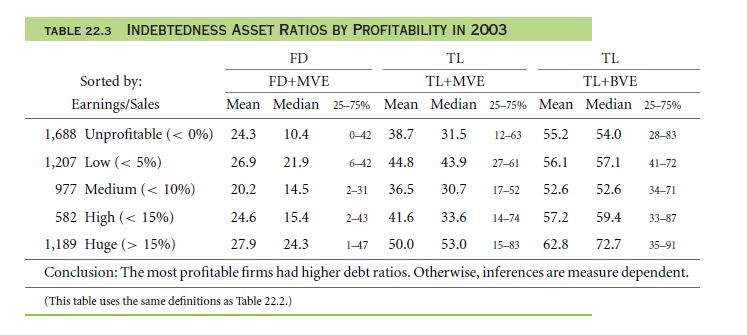
You may also get confuse over the fact that may be companies earning more profit annually will have much more different yet a much planned structure of capital. However Table 22.3 will clearly illustrate more profit earning companies = high ratio of indebtedness.However you cannot follow this pattern while measuring the financial ratios of debt in larger firms. It is suitable for obtaining the structure of their ratios of liability.
INDEBTEDNESS RATIOS BY INDUSTRY IN 2003
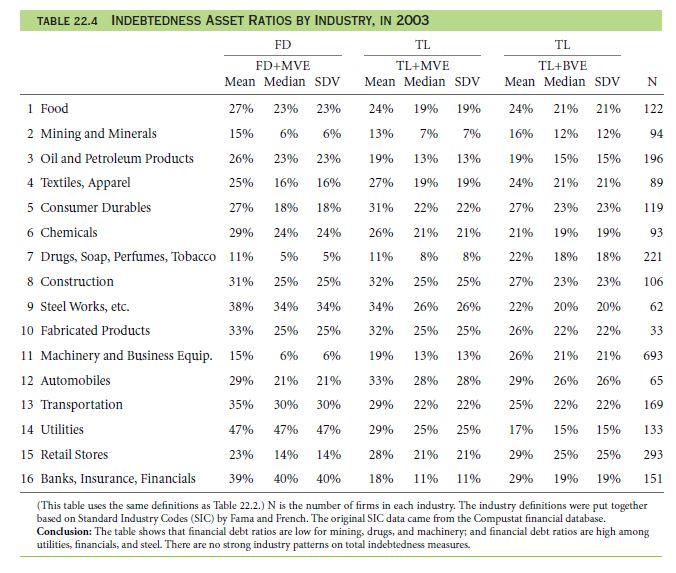
The next Table 22.4 will elaborate the structure of firms under the category of their industry during 2003.
Based on market worth these following firms had lower ratios of debt:
- Companies that manufactures Consumer-goods such as
- Tobacco
- Drugs
- Perfumes
- Soap
- Firms that make machinery equipments as well as business equipments
- Firms that are under the category of mining & mineral
Companies that incurred high ratios of debt related to finance:
- Steel
- Utilities
- Automobile
However you may find that the sectors giving out services related to finance have high ratios of financial debts, but compared to that their total ratio of indebtedness stood low and wide.
Note: An average deviation remained high when the firms had much more variable factors attached to them. It also happened inside the categories of industry. When some companies had ratios of high debt, some of the enterprises incurred lower ratios.
Now learn from where the patterns come. We can conclude some points before dealing deep into other formulas:
- Utilities companies – will tend to have ratios of high debts. Their variables depend on regulations laid by the Government.
- Financial Firms – they consider their high level of leverage as being a part of their structure of business.
- Transportation Firms – for example airlines. They experience a tally or balance between high and low coz they run parallel.
- Biotech companies – low ratios of debt related to finance, this happens because such companies are difficult to come to terms with.
- Drug development – their indebtedness can easily pass as equity. This happens because during failure of a drug their creditors don’t receive anything.
MEASURES AND COMPONENTS FOR SMALL AND LARGE FIRMS IN 2003
From database of finance related matters of Compust at you can analyze few other ratios & measures related to indebtedness. The details on ballpark figures will definitely change every year depending on samples.
Thus you can depend on the criteria based upon the market worth, similar to the one elaborated in Table 22.2.
Now we will compare between the averages derived against estimation of the IBM numbers. Reason behind it:
- For you to compare magnitudes
- Also make judgment on representation of the numbers of IBM
Now understand the financial debt larger to total liability or not:
Financial debt to the amount of total liabilities:
During 2003, IBM’s financial debt stood at $23.632 billion out of the value of sum of liabilities of $76.593 billion.
Thus you come to know that a 30% of ratio showed on IBM’s books were smaller when compared with larger firms. Thus:
- large firms = <½ of sum of liabilities relating to the debt of finance
- small firms = larger non-financial liabilities
- also in few small firms the ratio of financial liability was nil.
Sometimes small firms burrowed in an every day basis when particularly concerning trade credits.
Liabilities coming from Short-term & a sum total:
Among $76.593 billion of a sum total of liabilities IBM was having only $37.9 billion fell under short term.
Therefore when we consider large companies IBM emerged as a leading high-end example.
- This is because the larger companies= 1/3 sum total of liabilities when considering the short-term ratio.
- However smaller companies=2/3 liabilities when considering the short-term ratio.
Accounts payable – the sum of liabilities:
IBM had $8.46 billion in accounts payable.
From this study you can assume that when compared with larger companies, some small enterprises successfully financed their business by utilizing trade credit.
EQUITY VALUE MEASURES
By now you have already understand that equity book worth generally happens less than the market worth of equity. Now, learn the effect it has while quoting. When all companies are having the same ratios of book and market worth, you will much likely get a market worth that is based on debt ratio as same as the debt ratio based on book value. Thus, the rank of indebtedness of a firm when compare with other firms will cease to depend on the different quotation of ratios based upon book and market.
Book worth to market worth of equity:
IBM’ s market worth stood $157.047 billion
The book value stood $27.864 billion.
Thus you can see the lower ration of IBM obtained by evaluation book to market.
Note: Companies that tend to have lower ratios are also known as “growth firms”
However when you evaluate all categories of companies or enterprises you will find that book worthis lower that market values. But you can notice variations and difference even when firms are evaluated under a certain category of their business size.
22.2 C INTERNATIONAL INDEBTEDNESS RATIOS
You don’t always have to keep your analysis and research based on firms of the U.S. Therefore, here I will try to explore companies of other countries as well.However, the process is not a child’s play.
Take the example of South Korea:
It has four big firms and not much medium firms:
- Daewoo
- Samsung
- LG
- Hyundai
Then when we move on to Finland the conditions becomes almost extinct.
Now we can consider Nokia to be a leading company when talked with global aspect. However that does not show that you can consider Nokia to be bigger when compared to the individual large U.S firms. It doesn’t exactly come near to the 10% of top U.S. firms.
However you will have tougher times to obtain some data of companies irrespective of their sizes. Sometimes the information received with be unclear.
As the international rules of accounting and financing differ from border to border, you may have difficulty in comparing the ratios of debt & liabilities.
Now take few examples:
- German firms categorize financial reserves under liability. However you may consider it to be equity.
- Some countries do not record deferred taxes as due sections, thus it does not make it into the liability section.
- Activity of Mergers and Acquisitions can be a reason to change equity book worth.
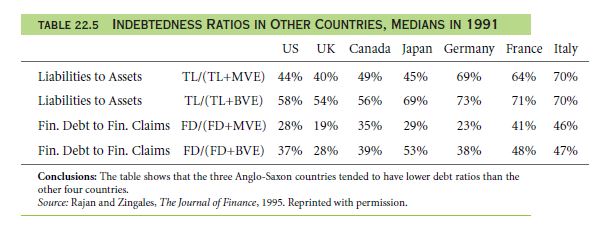
What happened during 1991, Table 22.5 will elaborate the information derived after studying the structure of capital in bigger companies. Even after having problems with the comparing issues capital structure remains somewhat same in the developed country’s firms.
Experts also saw that firms in all these countries tend to have variables characteristics. These variables had larger values. They also learned the Germany emerged as the only country where the bigger companies had low ratios of indebtedness.
Links of Previous Main Topic:-
- Introduction of corporate finance
- The time value of money and net present value
- Stock and bond valuation annuities and perpetuities
- A first encounter with capital budgeting rules
- Working with time varying rates of return
- Uncertainty default and risk
- Capital structure patterns in the united states
Links of Next Financial Accounting Topics:-


